Skip to content
cropped cropped chart diagram1 2.png

Charts | Diagrams | Graphs

Charts | Diagrams | Graphs

Menu

Primary menu

  • Top
  • General
    • Upload Diagram
    • Sign
  • Business
  • Economy
  • Sizes
  • Anatomy
  • Health
    • Workout
    • Food
    • Stress
    • Cancer
  • IT
  • Science
    • Energy
  • Women & Men
    • Clothes
    • Military
    • Tools

Least developed countries GDP per capita

Posted on May 11, 2026 by chartdiagram
Least developed countries GDP per capita

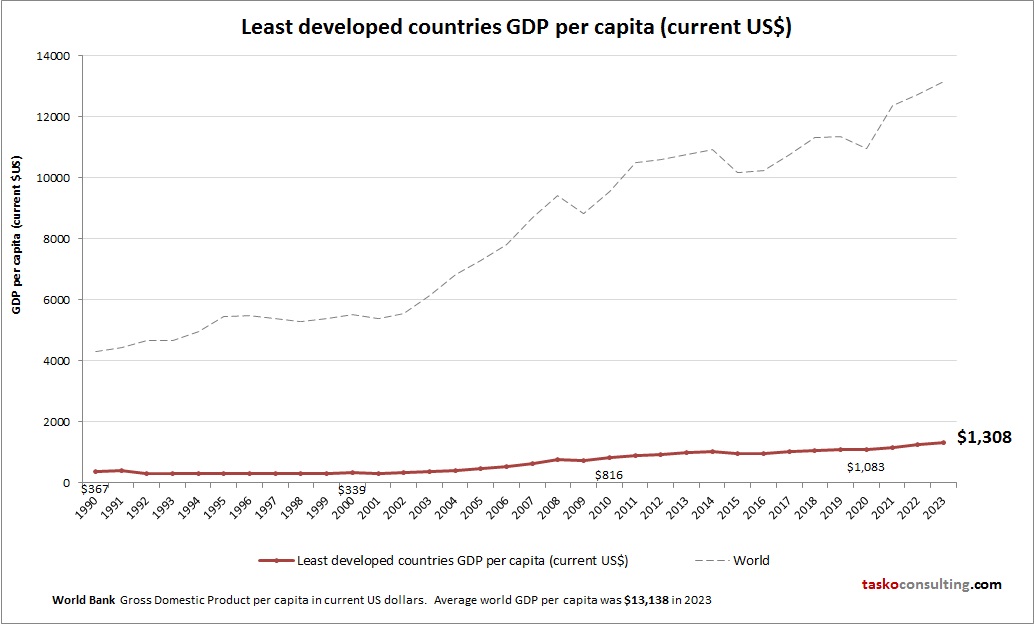
This graph shows Least developed countries GDP per capita. This is according to World Bank GDP stats by country. Based on the latest economic info provided for Least developed countries.

Tags: Least developed countries data, Least developed countries economy, Least developed countries GDP per person, Least developed countries gross domestic product per capita, Least developed countries statistics
This entry was posted in Economy and tagged Least developed countries data, Least developed countries economy, Least developed countries GDP per person, Least developed countries gross domestic product per capita, Least developed countries statistics by chartdiagram. Bookmark the permalink.

Post navigation

← Previous Previous post: St. Martin French part GDP per capita
Next → Next post: Accounting Ratios Description

Primary Sidebar Widget Area

Top Diagrams

  • 4ps of marketing 4ps Of Marketing
  • Plot Diagram
  • Geranium Plant Structures Geranium Plant Structures
  • Modern circle diagram template for powerpoint Modern Circle Diagram Template for PowerPoint
  • Political Compass Chart Political Compass Chart
  • hand diagram Hand Diagram
  • Evolution of the digital workplace Evolution of the Digital Workplace
  • Uq leadership framework human resources UQ Leadership Framework Human Resources
  • metric conversion Metric Conversion
  • Bra Sizes – Bra Chart
  • Crisis Management Model Crisis Management Model
  • mouth diagram Mouth Diagram
  • piano chord chart Piano Chord Chart
  • New product launch New Product Launch
  • Demographic Diagram 4 Demographic Diagram Explained
  • World Physical Map World Physical Map
  • Benin GDP per capita Benin GDP per capita
  • Transformational leadership model Transformational Leadership Model
  • Physics 2 Ka All Diagram Physics Diagram Example
  • Uk Political System Model Uk Political System Model

Latest Posts

  • Risk Management Process Diagram
  • Evolution of the Digital Workplace
  • Using the Five Forces Model in Industry Analysis
  • Body Diagram Physics Explained
  • More Efficient
  • Business Model Canvas Represented
  • Timeline Of Development
  • Generative Artificial Intelligence
  • Faculty Strategic Planning Process
  • Leadership Diagram Summary
  • Using a Network Diagram in Microsoft Project
  • Sales Steps
  • Scrum agile basics salesforce development methodology salesforce
  • Cloud Computing Architecture Graphic
  • Scrum methodology an agile framework for project management

Top 20 Tags

  • size (30)
  • food (7)
  • food chart (7)
  • food diagram (7)
  • skin (6)
  • cities (6)
  • world (6)
  • population (6)
  • conversion (6)
  • cancer (5)
  • alcohol diagram (5)
  • business strategy diagram (5)
  • sales process diagram (5)
  • car diagram (4)
  • cloud computing diagram (4)
  • water cycle (4)
  • stress (4)
  • how stress affects body (4)
  • yoga (4)
  • yoga poses (4)

Category

  • Anatomy
  • Business
  • Cancer
  • Clothes
  • Economy
  • Energy
  • Food
  • General
  • Health
  • IT
  • Military
  • Science
  • Sign
  • Sizes
  • Stress
  • Tools
  • Top
  • Women & Men
  • Workout
Copyright © 2026 Charts | Diagrams | Graphs. All Rights Reserved.
Theme: Catch Box by Catch Themes
Scroll Up