Singapore GDP per capita
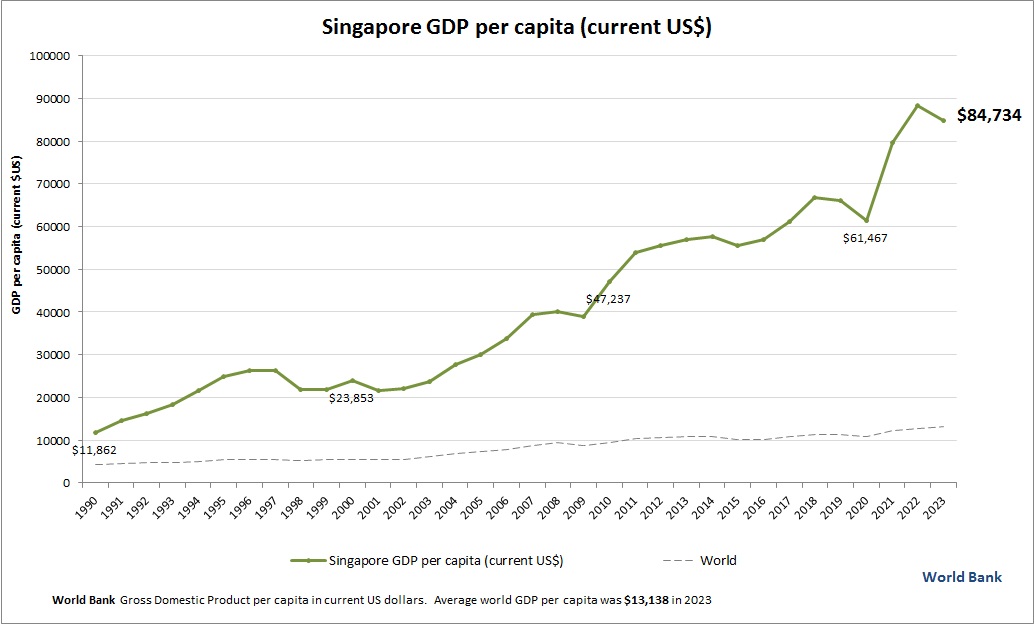
This diagram presents Singapore GDP per capita. This is according to World Bank GDP stats by country. Based on the latest available information for Singapore.

Charts | Diagrams | Graphs
This diagram presents Singapore GDP per capita. This is according to World Bank GDP stats by country. Based on the latest available information for Singapore.
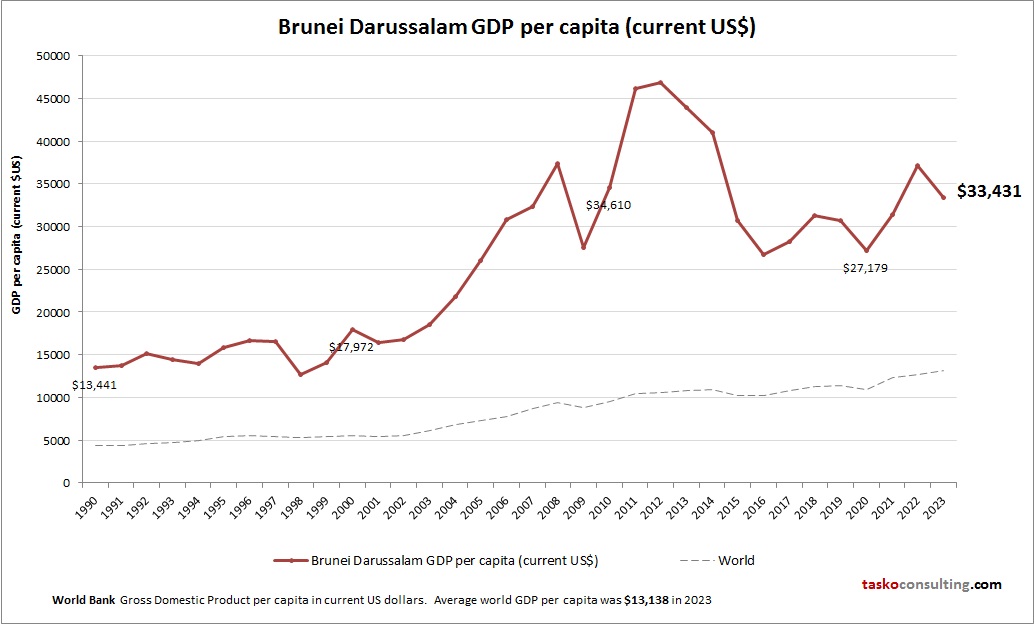
This chart demonstrates Brunei Darussalam GDP per capita. World Bank is the source of this economic data. Based on the latest available information for Brunei Darussalam.
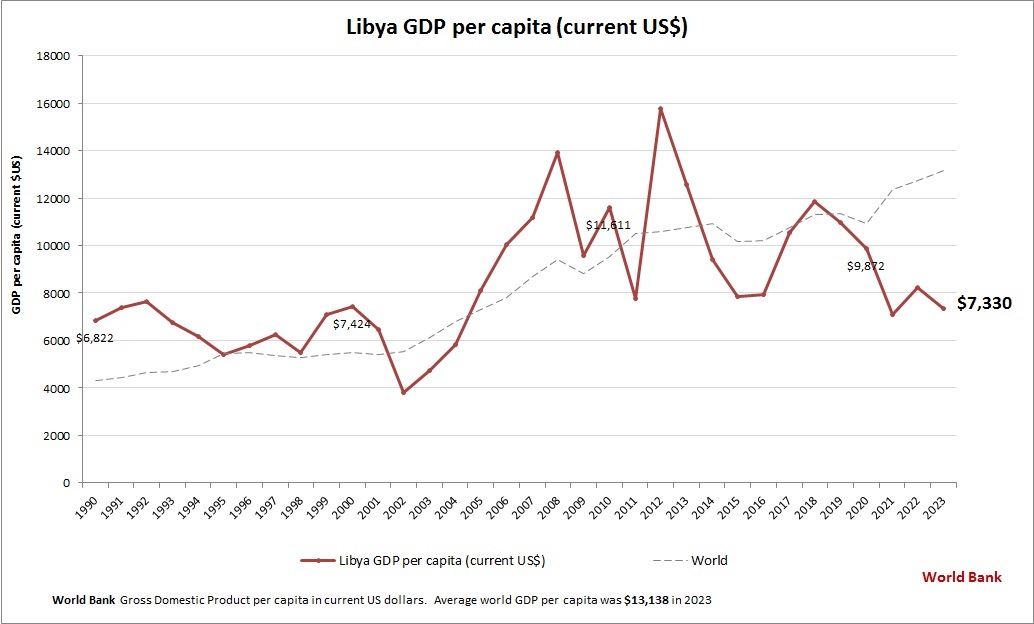
This chart demonstrates Libya GDP per capita. The gross domestic product statistics are compiled by World Bank. Based on the latest economic info provided for Libya.

This graph shows Senegal GDP per capita. World Bank is the source of this economic data. Latest GDP per person information for Senegal.
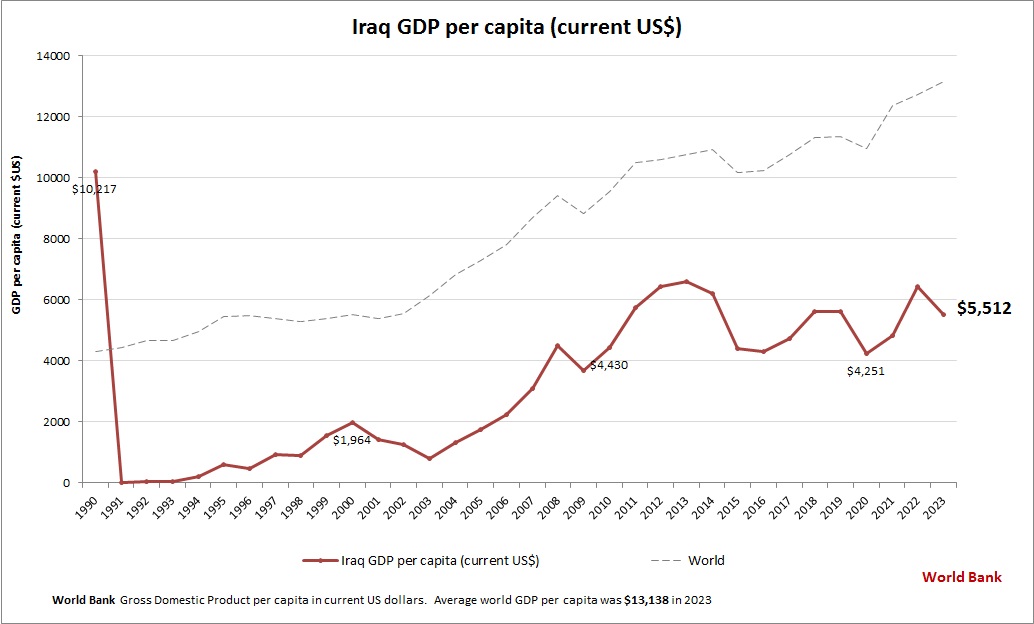
This graph shows Iraq GDP per capita. This is according to World Bank GDP stats by country. Latest GDP per person information for Iraq.
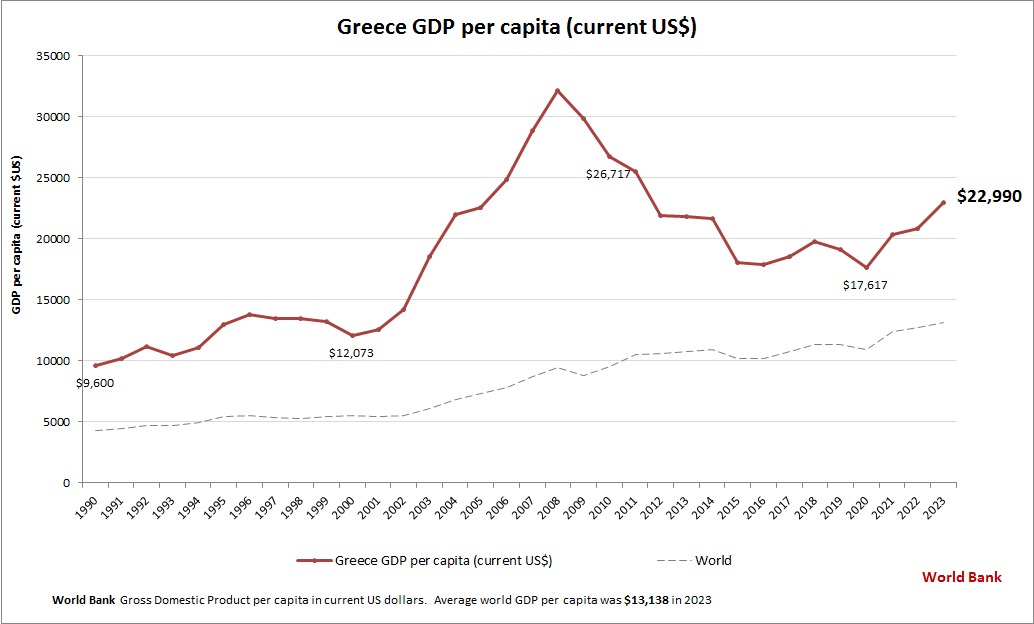
This diagram presents Greece GDP per capita. This is according to World Bank GDP stats by country. Based on the latest economic info provided for Greece.
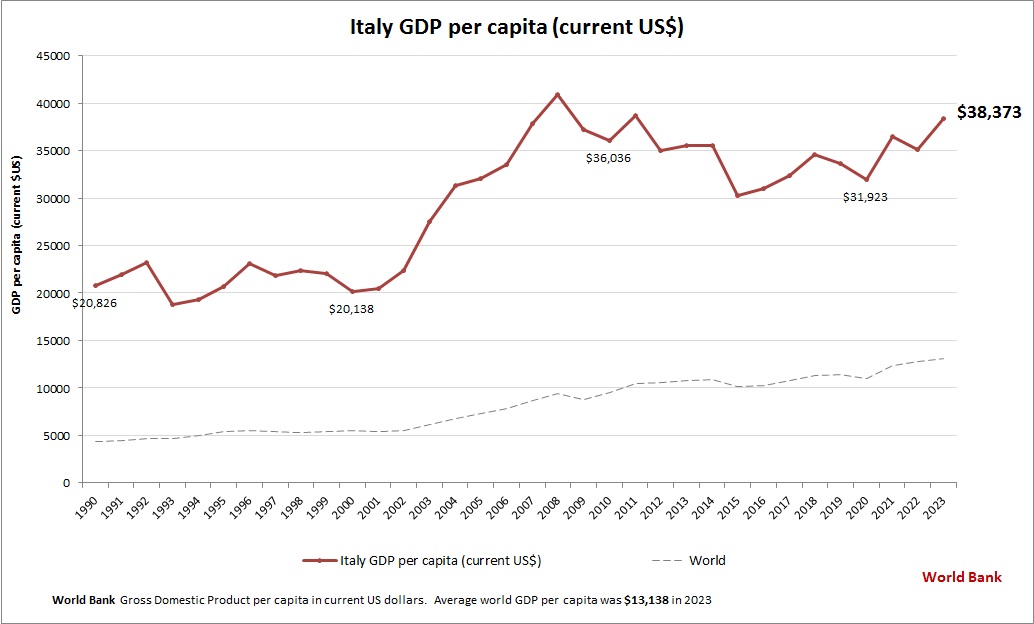
This chart demonstrates Italy GDP per capita. This is according to World Bank GDP stats by country. Based on the latest economic info provided for Italy.

This diagram presents Turks and Caicos Islands GDP per capita. World Bank is the source of this economic data. Based on the latest available information for Turks and Caicos Islands.
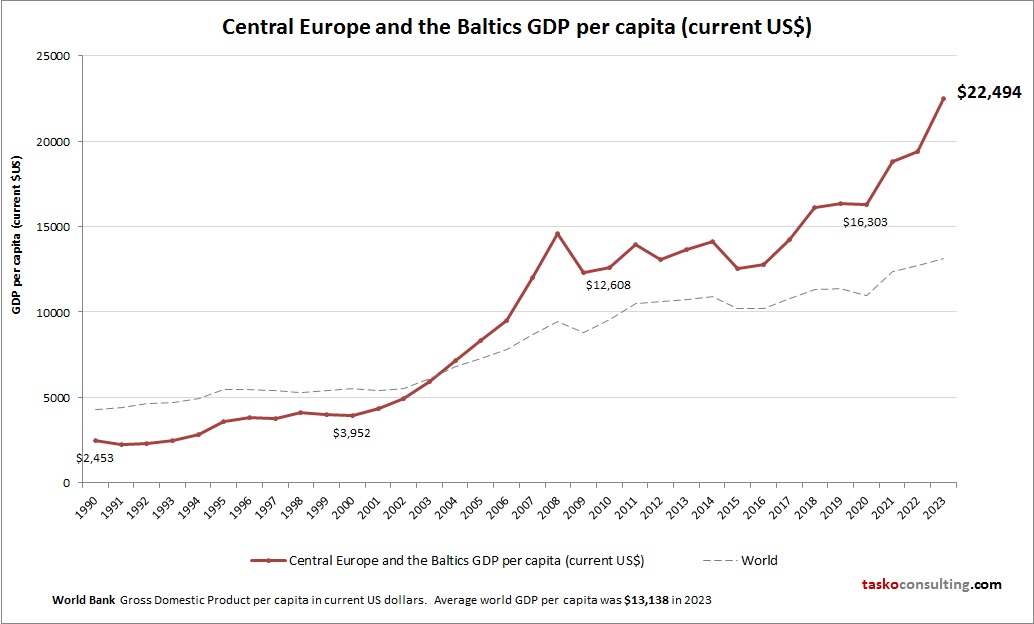
This chart demonstrates Central Europe and the Baltics GDP per capita. The gross domestic product statistics are compiled by World Bank. Latest GDP per person information for Central Europe and the Baltics.
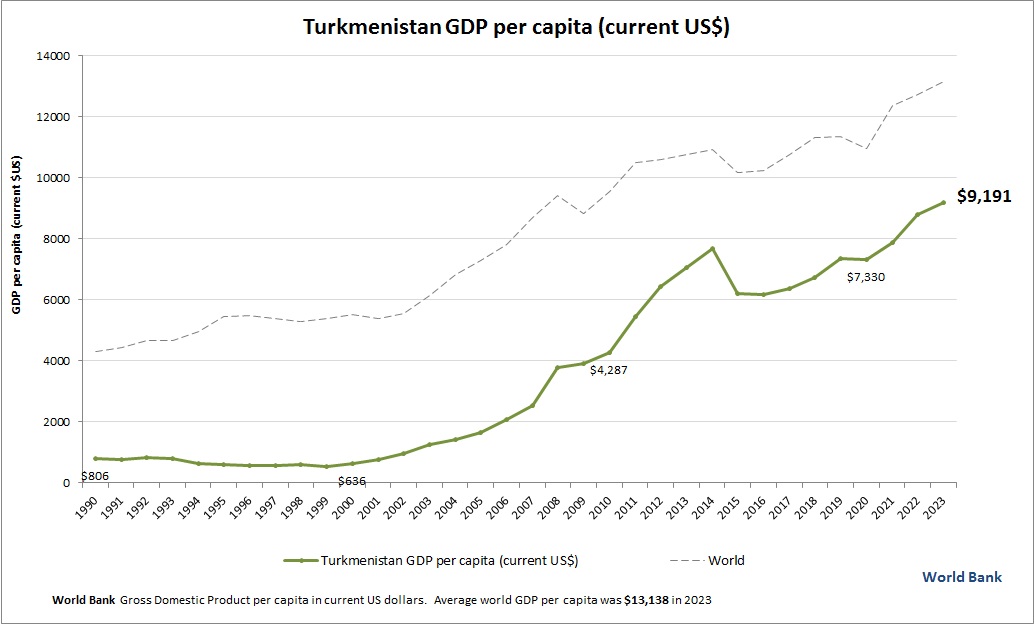
This chart demonstrates Turkmenistan GDP per capita. The gross domestic product statistics are compiled by World Bank. Based on the latest economic info provided for Turkmenistan.