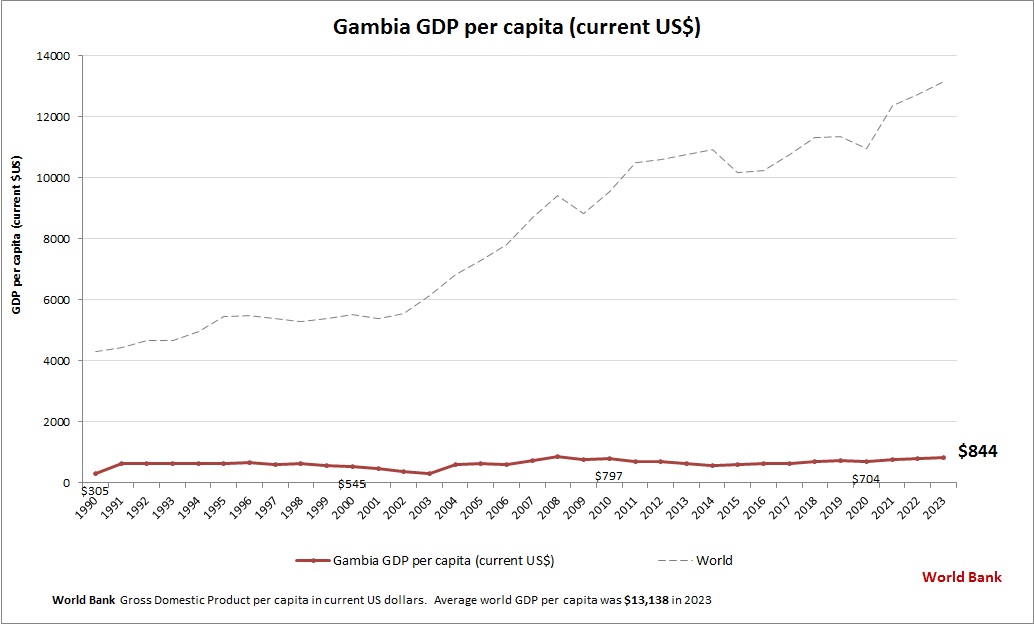
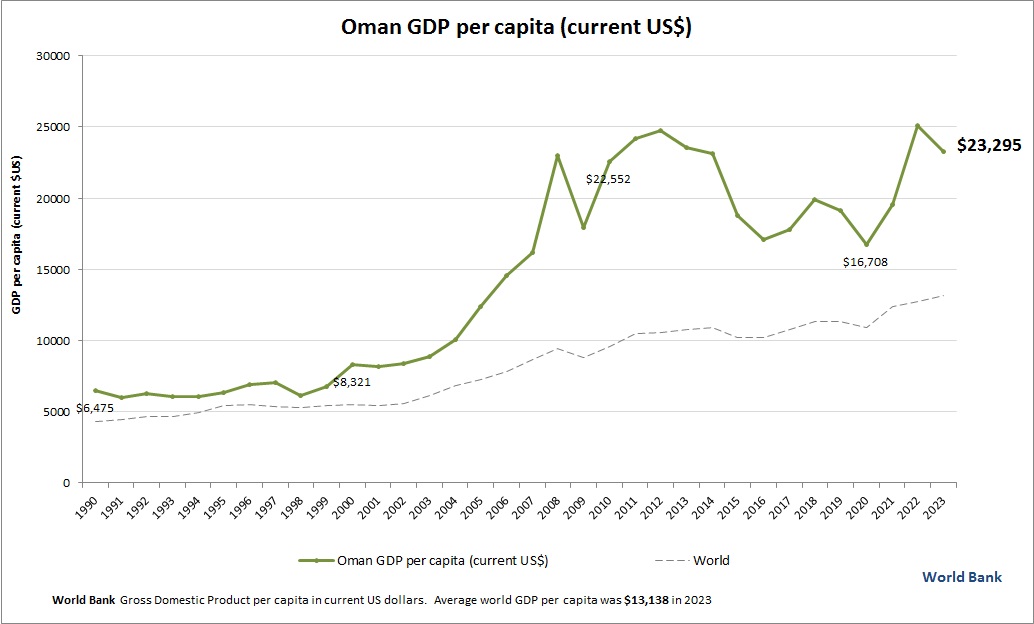
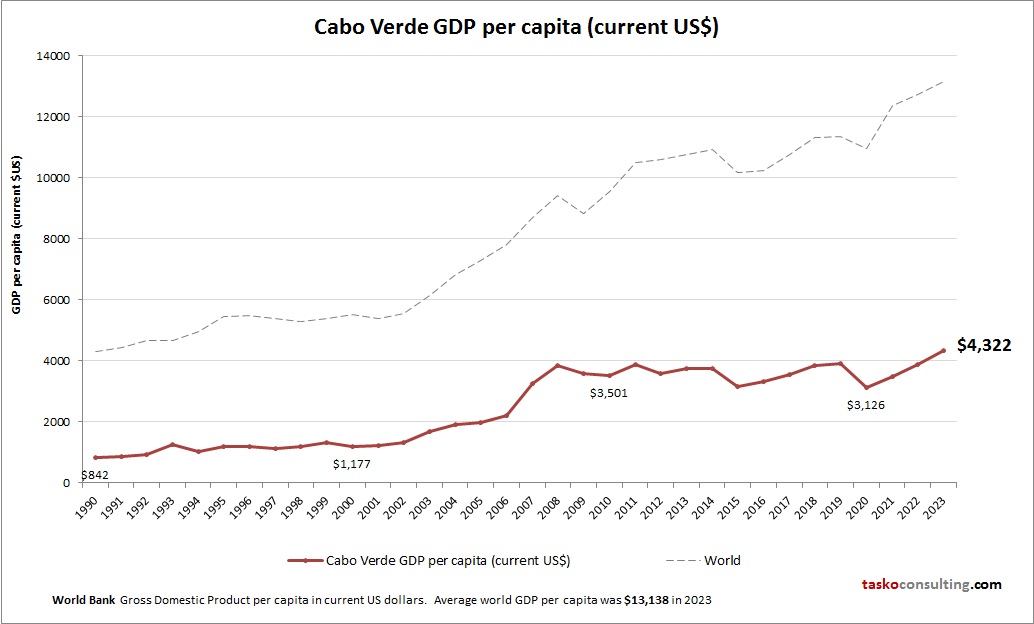
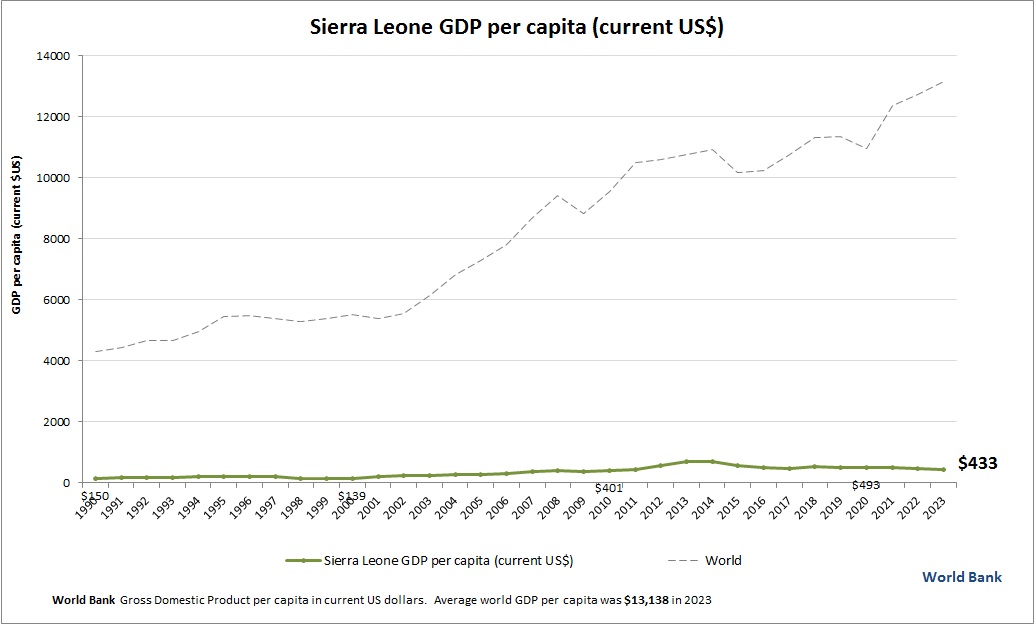
Africa Eastern and Southern GDP per capita
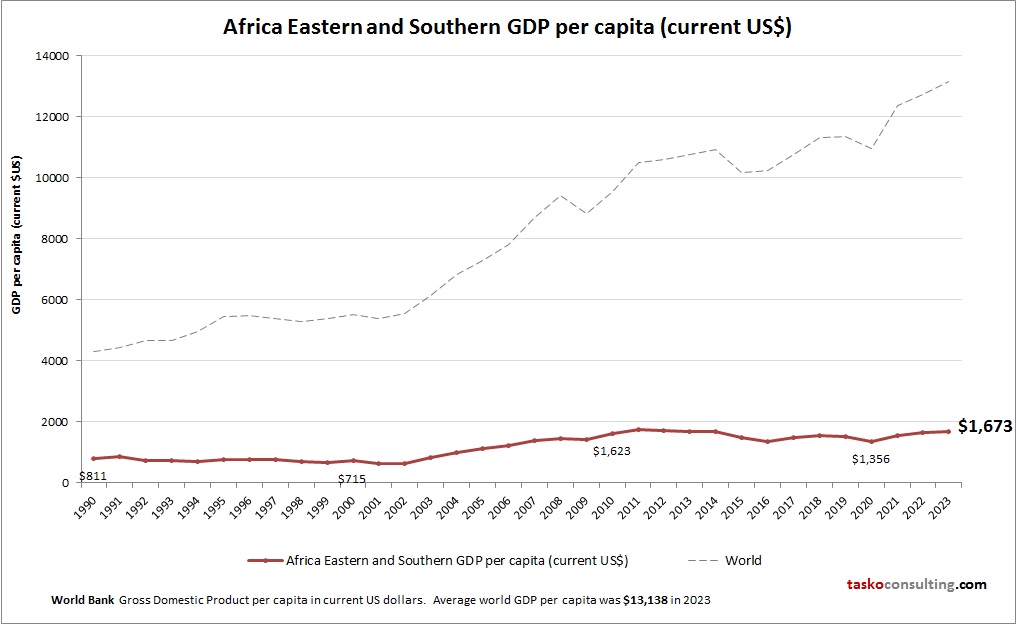
This graph shows Africa Eastern and Southern GDP per capita. World Bank is the source of this economic data. Latest GDP per person information for Africa Eastern and Southern.