Skip to content
cropped cropped chart diagram1 2.png

Charts | Diagrams | Graphs

Charts | Diagrams | Graphs

Menu

Primary menu

  • Top
  • General
    • Upload Diagram
    • Sign
  • Business
  • Economy
  • Sizes
  • Anatomy
  • Health
    • Workout
    • Food
    • Stress
    • Cancer
  • IT
  • Science
    • Energy
  • Women & Men
    • Clothes
    • Military
    • Tools

Oman GDP per capita

Posted on February 15, 2026 by chartdiagram
Oman GDP per capita

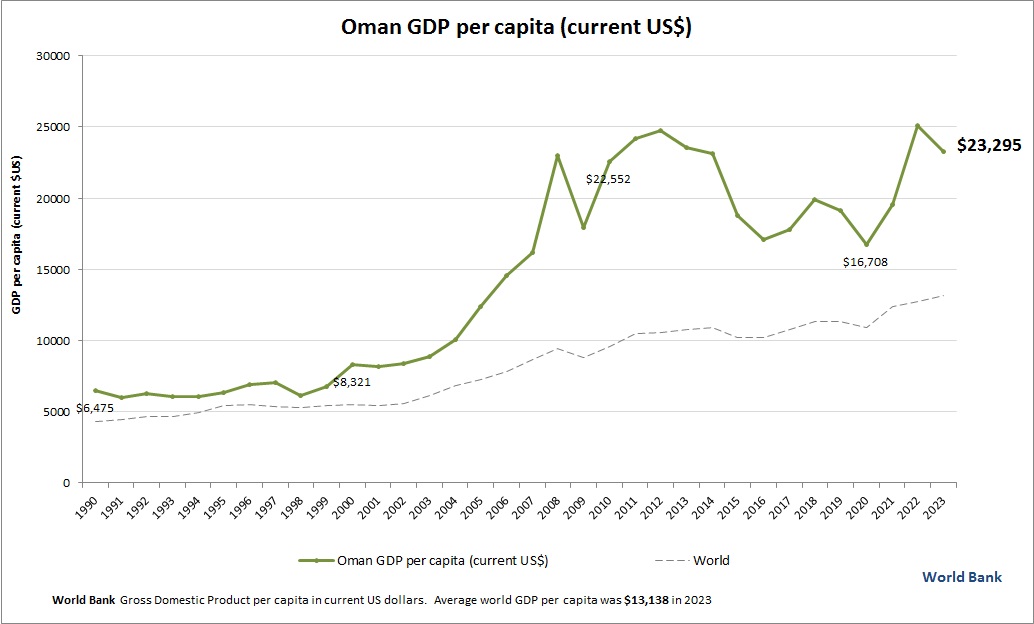
This graph shows Oman GDP per capita. World Bank is the source of this economic data. Based on the latest available information for Oman.

Tags: Oman data, Oman economy, Oman GDP per person, Oman gross domestic product per capita, Oman statistics
This entry was posted in Economy and tagged Oman data, Oman economy, Oman GDP per person, Oman gross domestic product per capita, Oman statistics by chartdiagram. Bookmark the permalink.

Post navigation

← Previous Previous post: Communication Plan
Next → Next post: Agile Project Management with Scrum Training Material

Primary Sidebar Widget Area

Top Diagrams

  • Situational leadership model Situational Leadership Model

  • bust cup size diagram Bust cup size diagram

  • Eye Colors

  • Uk Population Pyramid Uk Population Pyramid

  • Increase Efficiency Increase Efficiency

  • 2nd Grade Math Tape Diagrams 2nd Grade Math Tape Diagrams

  • Liechtenstein GDP per capita Liechtenstein GDP per capita

  • Scrum diagram the scrum framework captured in simple one picture Scrum Diagram

  • Audit walkthrough Audit Walkthrough

  • essay structure Essay Structure

  • Pareto Diagram – Pareto Chart

  • How Stress Affects Human Body How Stress Affects Human Body

  • Bra Sizes – Bra Chart

  • Fastener size chart Fastener size chart

  • Sales Process Sales Process

  • How Stress Affects Body How Stress Affects Body

  • Physics Symbols Chart 92 Physics Symbols Explained

  • Baby Month by Month – Pregnancy Stages

  • Timeline Template 26 Timeline Chart Template

  • Wellness

Latest Posts

  • Audit Walkthrough
  • 2nd Grade Math Tape Diagrams
  • Analytical Framework
  • Zsales Process Flowchart
  • Malawi GDP per capita
  • Most Important Science Diagrams
  • Morocco GDP per capita
  • Lean Business Model Strategies
  • Data Governance Framework
  • Russia GDP per capita
  • Upper Course River Features
  • Technologyactive Structure Element
  • Personal Business Model Canvas
  • Competitive Analysis Template
  • Kubernetes Web Application Architecture

Top 20 Tags

  • size (30)
  • food (7)
  • food chart (7)
  • food diagram (7)
  • skin (6)
  • cities (6)
  • world (6)
  • population (6)
  • conversion (6)
  • cancer (5)
  • alcohol diagram (5)
  • business strategy diagram (5)
  • sales process diagram (5)
  • car diagram (4)
  • water cycle (4)
  • stress (4)
  • how stress affects body (4)
  • yoga (4)
  • yoga poses (4)
  • yoga workout (4)

Category

  • Anatomy
  • Business
  • Cancer
  • Clothes
  • Economy
  • Energy
  • Food
  • General
  • Health
  • IT
  • Military
  • Science
  • Sign
  • Sizes
  • Stress
  • Tools
  • Top
  • Women & Men
  • Workout
Copyright © 2026 Charts | Diagrams | Graphs. All Rights Reserved.
Theme: Catch Box by Catch Themes
Scroll Up