Skip to content
cropped cropped chart diagram1 2.png

Charts | Diagrams | Graphs

Charts | Diagrams | Graphs

Menu

Primary menu

  • Top
  • General
    • Upload Diagram
    • Sign
  • Business
  • Economy
  • Sizes
  • Anatomy
  • Health
    • Workout
    • Food
    • Stress
    • Cancer
  • IT
  • Science
    • Energy
  • Women & Men
    • Clothes
    • Military
    • Tools

Tag Archives: Euro area data

Euro area GDP per capita

Posted on October 10, 2025 by chartdiagram
Euro area GDP per capita

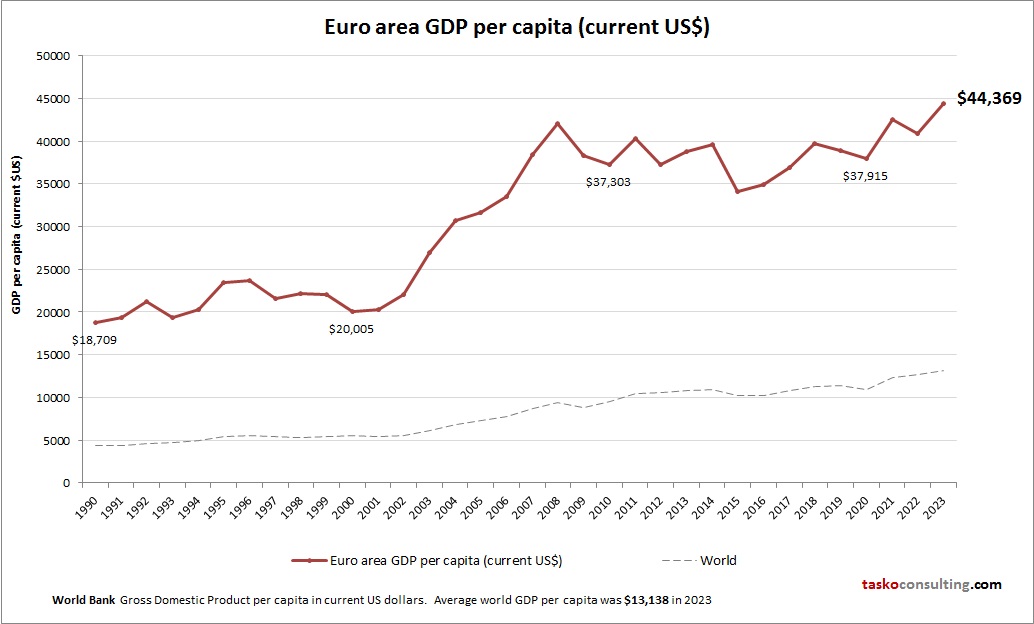
This diagram presents Euro area GDP per capita. This is according to World Bank GDP stats by country. Based on the latest economic info provided for Euro area.

Posted in Economy | Tagged Euro area data, Euro area economy, Euro area GDP per person, Euro area gross domestic product per capita, Euro area statistics

Primary Sidebar Widget Area

Top Diagrams

  • Pareto Diagram – Pareto Chart
  • muscular system diagram Muscular System Diagram
  • Life History Diagram 50 History of Life Diagram
  • Estrogen rich food chart Estrogen rich food chart
  • Plot Diagram
  • Leadership strategy and delivery Leadership Strategy and Delivery
  • Kyrgyzstan GDP per capita Kyrgyzstan GDP per capita
  • Mozambique GDP per capita Mozambique GDP per capita
  • Costa Rica GDP per capita Costa Rica GDP per capita
  • Slovenia GDP per capita Slovenia GDP per capita
  • Modern leader qualities Modern Leader Qualities
  • Renaissance Art History Timeline Renaissance Art History Timeline
  • Pounds to Kilograms – Kilograms to Pounds Chart
  • Political Compass Chart Political Compass Chart
  • Dynamic systems development method how it led to agile project management Dynamic Systems Development Method
  • Agile model of software development the development cycle Agile Model of Software Development the Development Cycle
  • cigarettes chemicals chart Cigarettes Chemicals Chart
  • Timeline Template 26 Timeline Chart Template
  • Libya GDP per capita Libya GDP per capita
  • Sales Steps Sales Steps

Latest Posts

  • Kyrgyzstan GDP per capita
  • Leadership Strategy and Delivery
  • Competency-Based HR Management PPT Slides
  • Cayman Islands GDP per capita
  • System Architecture Diagram Tool Online
  • Kiribati GDP per capita
  • glass skyscraper
  • Simple Pendulum Diagram
  • Production Process Diagram
  • Cognitive Illustration
  • Aimultiple Digital Transformation Framework
  • Nonprofit Operating Models
  • Business Strategy Mind Map
  • Cloud Service Models Representation
  • Costa Rica GDP per capita

Top 20 Tags

  • size (30)
  • food (7)
  • food chart (7)
  • food diagram (7)
  • skin (6)
  • cities (6)
  • world (6)
  • population (6)
  • conversion (6)
  • cancer (5)
  • alcohol diagram (5)
  • business strategy diagram (5)
  • sales process diagram (5)
  • car diagram (4)
  • cloud computing diagram (4)
  • water cycle (4)
  • stress (4)
  • how stress affects body (4)
  • yoga (4)
  • yoga poses (4)

Category

  • Anatomy
  • Business
  • Cancer
  • Clothes
  • Economy
  • Energy
  • Food
  • General
  • Health
  • IT
  • Military
  • Science
  • Sign
  • Sizes
  • Stress
  • Tools
  • Top
  • Women & Men
  • Workout
Copyright © 2026 Charts | Diagrams | Graphs. All Rights Reserved.
Theme: Catch Box by Catch Themes
Scroll Up