Skip to content
cropped cropped chart diagram1 2.png

Charts | Diagrams | Graphs

Charts | Diagrams | Graphs

Menu

Primary menu

  • Top
  • General
    • Upload Diagram
    • Sign
  • Business
  • Economy
  • Sizes
  • Anatomy
  • Health
    • Workout
    • Food
    • Stress
    • Cancer
  • IT
  • Science
    • Energy
  • Women & Men
    • Clothes
    • Military
    • Tools

Tag Archives: Guinea Bissau data

Guinea Bissau GDP per capita

Posted on April 16, 2025 by chartdiagram
Guinea Bissau GDP per capita

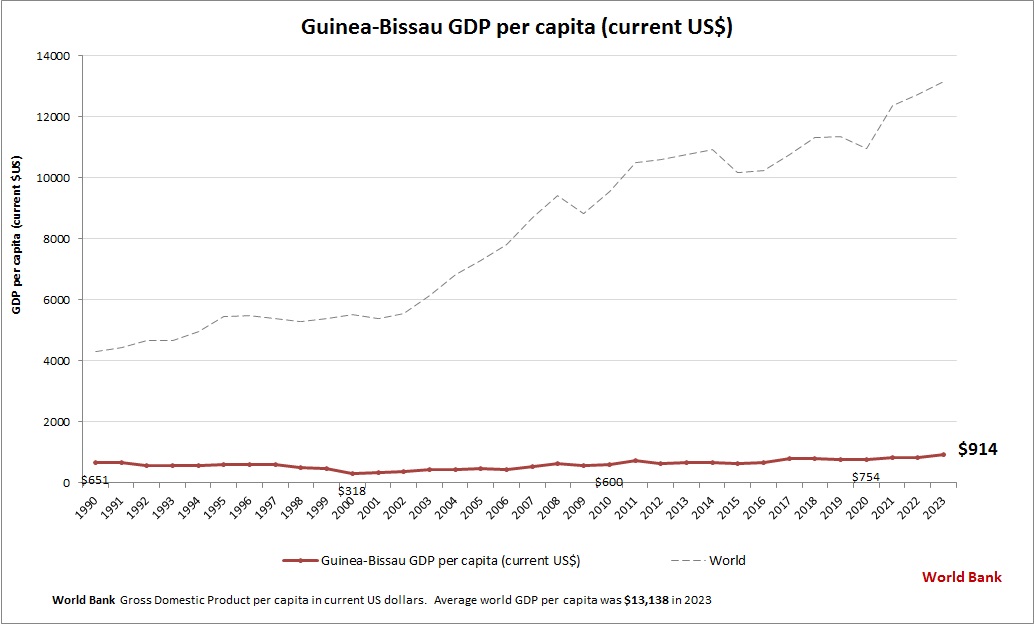
This diagram presents Guinea Bissau GDP per capita. The gross domestic product statistics are compiled by World Bank. Based on the latest economic info provided for Guinea Bissau.

Posted in Economy | Tagged Guinea Bissau data, Guinea Bissau economy, Guinea Bissau GDP per person, Guinea Bissau gross domestic product per capita, Guinea Bissau statistics

Primary Sidebar Widget Area

Top Diagrams

  • Uk Population Pyramid Uk Population Pyramid

  • Branches Of Philosophy 87 Branches Of Philosophy Diagram

  • Russia GDP per capita Russia GDP per capita

  • Upper Course River Features Upper Course River Features

  • Development of the market analysis framework Development of the Market Analysis Framework

  • Bra size conversion international Bra size conversion international

  • Gap Analysis Approach Gap Analysis Approach

  • Political Compass Chart Political Compass Chart

  • United Arab Emirates GDP per capita United Arab Emirates GDP per capita

  • diabetes chart Diabetes Chart

  • Marshall Islands GDP per capita Marshall Islands GDP per capita

  • Women's Clothing Size Chart Women’s Clothing Size Chart

  • New product launch New Product Launch

  • Health Venn Diagram Graphic Health Venn Diagram Graphic

  • Gabon GDP per capita Gabon GDP per capita

  • Change management framework what is change management Change management framework what is change management

  • essay structure Essay Structure

  • Agile model of software development the development cycle Agile Model of Software Development the Development Cycle

  • Neuroscience leadership culture Neuroscience Leadership Culture

  • Body Mass Index Height vs Weight Body Mass Index Height vs Weight

Latest Posts

  • Russia GDP per capita
  • Upper Course River Features
  • Technologyactive Structure Element
  • Personal Business Model Canvas
  • Competitive Analysis Template
  • Kubernetes Web Application Architecture
  • New Product Launch
  • Modern Circle Diagram Template for PowerPoint
  • Afghanistan GDP per capita
  • Leadership and Management
  • Enterprise Business Architecture Framework
  • Human Excretory System Represented
  • BeFunky Collage
  • Adkar change management model google slides templates
  • Marketing Sales Funnel

Top 20 Tags

  • size (30)
  • food (7)
  • food chart (7)
  • food diagram (7)
  • skin (6)
  • cities (6)
  • world (6)
  • population (6)
  • conversion (6)
  • cancer (5)
  • alcohol diagram (5)
  • business strategy diagram (5)
  • sales process diagram (5)
  • car diagram (4)
  • water cycle (4)
  • stress (4)
  • how stress affects body (4)
  • yoga (4)
  • yoga poses (4)
  • yoga workout (4)

Category

  • Anatomy
  • Business
  • Cancer
  • Clothes
  • Economy
  • Energy
  • Food
  • General
  • Health
  • IT
  • Military
  • Science
  • Sign
  • Sizes
  • Stress
  • Tools
  • Top
  • Women & Men
  • Workout
Copyright © 2026 Charts | Diagrams | Graphs. All Rights Reserved.
Theme: Catch Box by Catch Themes
Scroll Up