Skip to content
cropped cropped chart diagram1 2.png

Charts | Diagrams | Graphs

Charts | Diagrams | Graphs

Menu

Primary menu

  • Top
  • General
    • Upload Diagram
    • Sign
  • Business
  • Economy
  • Sizes
  • Anatomy
  • Health
    • Workout
    • Food
    • Stress
    • Cancer
  • IT
  • Science
    • Energy
  • Women & Men
    • Clothes
    • Military
    • Tools

Tag Archives: lean manufacturing model

just in time

Posted on June 7, 2025 by chartdiagram
just in time

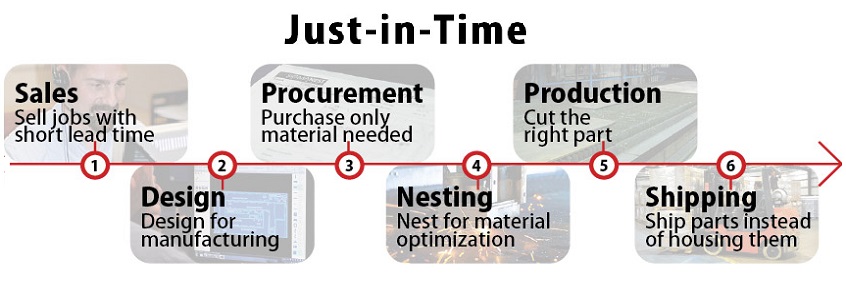
just in time: Just-in-Time (JIT) is an inventory management philosophy that aligns production with demand to reduce waste and inventory costs. By receiving goods only as they are needed, businesses improve efficiency and minimize storage needs. JIT requires tight supplier coordination and precise forecasting.

Posted in Business | Tagged JIT diagram, JIT flowchart, just in time inventory, lean manufacturing model, production efficiency

Primary Sidebar Widget Area

Top Diagrams

  • blood flow diagram Blood Flow Diagram
  • B2B Sales Process Flowchart B2B Sales Process Flowchart
  • El Salvador GDP per capita El Salvador GDP per capita
  • Ear Diagram – Ear Anatomy
  • How to Wear a Mask How to Wear a Mask
  • baby pants measurement chart Baby pants measurement chart
  • Bra Sizes – Bra Chart
  • Keto Diet Grocery List Keto Diet Grocery List
  • Plant Photosynthesis Diagram Plant Photosynthesis Diagram
  • Business casual for men and women Business casual for men and women
  • Framework asset management Framework Asset Management
  • Alfred Barr Flowing Tree Of Modern Art Alfred Barr Flowing Tree Of Modern Art
  • Plant Cell Diagram
  • Maslow’s Hierarchy of Needs
  • Uk Mattress Sizes Uk Mattress Sizes
  • Estrogen rich food chart Estrogen rich food chart
  • Cloud Computing
  • shoe size chart Shoe Size Chart
  • Human Body – Human Anatomy
  • fracking diagram Fracking Diagram

Latest Posts

  • Framework Asset Management
  • B2B Sales Process Flowchart
  • tasco consluting3
  • Bahamas GDP per capita
  • Component Of Information Technology
  • The defining components of leadership
  • Strategic Partnership Framework
  • Scrum methodology for digital product development
  • El Salvador GDP per capita
  • Economic System Diagram Framework
  • Zambia GDP per capita
  • Talent Management Models
  • DMAIC
  • Services value chain analysis management industry framework
  • Mauritius GDP per capita

Top 20 Tags

  • size (30)
  • food (7)
  • food chart (7)
  • food diagram (7)
  • skin (6)
  • cities (6)
  • world (6)
  • population (6)
  • conversion (6)
  • cancer (5)
  • alcohol diagram (5)
  • sales process diagram (5)
  • car diagram (4)
  • water cycle (4)
  • stress (4)
  • how stress affects body (4)
  • yoga (4)
  • yoga poses (4)
  • yoga workout (4)
  • best yoga (4)

Category

  • Anatomy
  • Business
  • Cancer
  • Clothes
  • Economy
  • Energy
  • Food
  • General
  • Health
  • IT
  • Military
  • Science
  • Sign
  • Sizes
  • Stress
  • Tools
  • Top
  • Women & Men
  • Workout
Copyright © 2025 Charts | Diagrams | Graphs. All Rights Reserved.
Theme: Catch Box by Catch Themes
Scroll Up