Skip to content
cropped cropped chart diagram1 2.png

Charts | Diagrams | Graphs

Charts | Diagrams | Graphs

Menu

Primary menu

  • Top
  • General
    • Upload Diagram
    • Sign
  • Business
  • Economy
  • Sizes
  • Anatomy
  • Health
    • Workout
    • Food
    • Stress
    • Cancer
  • IT
  • Science
    • Energy
  • Women & Men
    • Clothes
    • Military
    • Tools

Tag Archives: St. Lucia data

St. Lucia GDP per capita

Posted on April 25, 2025 by chartdiagram
St. Lucia GDP per capita

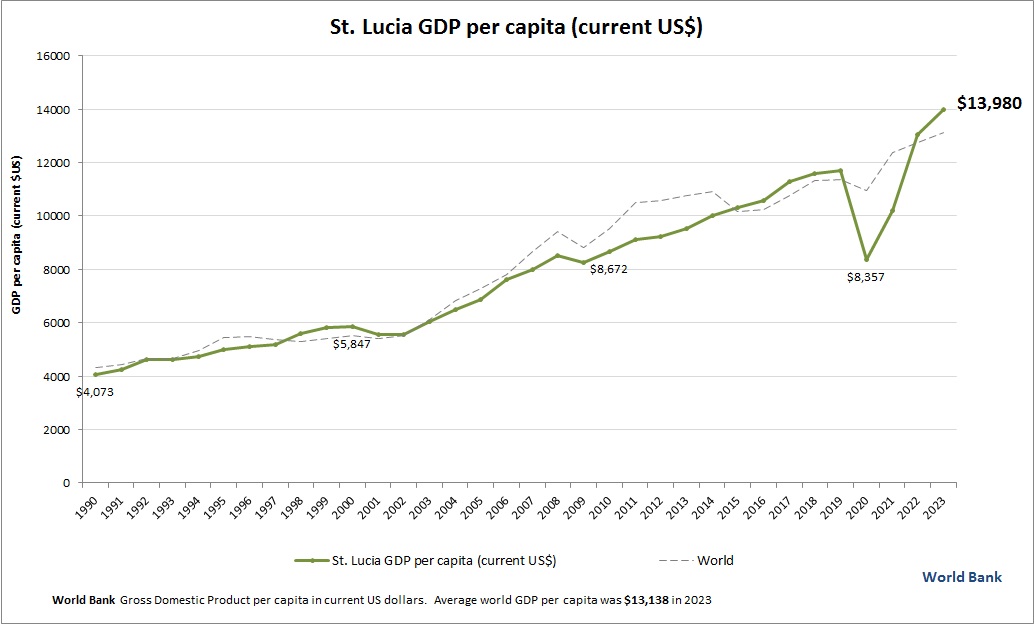
This graph shows St. Lucia GDP per capita. This is according to World Bank GDP stats by country. Based on the latest available information for St. Lucia.

Posted in Economy | Tagged St. Lucia data, St. Lucia economy, St. Lucia GDP per person, St. Lucia gross domestic product per capita, St. Lucia statistics

Primary Sidebar Widget Area

Top Diagrams

  • shoe size chart Shoe Size Chart
  • pdca PDCA
  • top lean tools Top Lean Tools
  • Agile development Agile Development
  • Chemical Structures Of 10 Bases Chemical Structures Of 10 Bases
  • Adult leadership flow chart Adult leadership flow chart
  • Social Media By Age Group Social Media By Age Group
  • Us Population By Age 1 Us Population By Age 1
  • Modern vector timeline. Workflow chart infographic concept for marketing presentation Modern Vector Timeline. Workflow Chart Infographic Concept for Marketing Presentation
  • Microscope Diagram
  • Maslow’s Hierarchy of Needs
  • Djibouti GDP per capita Djibouti GDP per capita
  • Strategic Planning Cycle Strategic Planning Cycle
  • blood flow diagram Blood Flow Diagram
  • Architecture History Timeline 34 Architecture History Diagram
  • What is a pestel analysis and why it matters What is a PESTEL Analysis and Why It Matters
  • St. Vincent and the Grenadines GDP per capita St. Vincent and the Grenadines GDP per capita
  • Heart Attack Signs Men vs Women Heart Attack Signs Men vs Women
  • Business capability analysis template Business Capability Analysis Template
  • Dna Powerpoint Template Dna Powerpoint Template

Latest Posts

  • Agile Development
  • PDCA
  • What is a PESTEL Analysis and Why It Matters
  • St. Vincent and the Grenadines GDP per capita
  • Dot And Cross Diagrams Of Ionic Bonding
  • What Is Blockchain Technology
  • Modern Vector Timeline. Workflow Chart Infographic Concept for Marketing Presentation
  • Customer Service Standards
  • Top Lean Tools
  • Us Population By Age 1
  • Strategic Planning Cycle
  • Adult leadership flow chart
  • Cell Structure And Function
  • Equilibrium Of A Stationary Man
  • Djibouti GDP per capita

Top 20 Tags

  • size (30)
  • food (7)
  • food chart (7)
  • food diagram (7)
  • skin (6)
  • cities (6)
  • world (6)
  • population (6)
  • conversion (6)
  • cancer (5)
  • alcohol diagram (5)
  • car diagram (4)
  • water cycle (4)
  • stress (4)
  • how stress affects body (4)
  • yoga (4)
  • yoga poses (4)
  • yoga workout (4)
  • best yoga (4)
  • solar energy (4)

Category

  • Anatomy
  • Business
  • Cancer
  • Clothes
  • Economy
  • Energy
  • Food
  • General
  • Health
  • IT
  • Military
  • Science
  • Sign
  • Sizes
  • Stress
  • Tools
  • Top
  • Women & Men
  • Workout
Copyright © 2025 Charts | Diagrams | Graphs. All Rights Reserved.
Theme: Catch Box by Catch Themes
Scroll Up