Skip to content
cropped cropped chart diagram1 2.png

Charts | Diagrams | Graphs

Charts | Diagrams | Graphs

Menu

Primary menu

  • Top
  • General
    • Upload Diagram
    • Sign
  • Business
  • Economy
  • Sizes
  • Anatomy
  • Health
    • Workout
    • Food
    • Stress
    • Cancer
  • IT
  • Science
    • Energy
  • Women & Men
    • Clothes
    • Military
    • Tools

Tag Archives: state diagram

State Diagram

Posted on February 5, 2022 by chartdiagram
state diagram

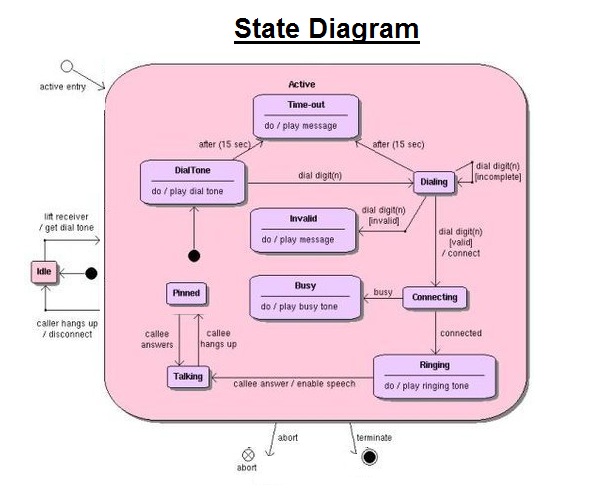
State Chart – State Diagram – State Graph – State charts, state diagrams and state plots are visual representations of State tables. This type of diagram is good for depiction of various system states. state diagram

Posted in IT | Tagged state, state chart, state charts, state diagram, state diagrams, state graph, state graphic, state graphs, state image, state infographic, state plot, state table

Primary Sidebar Widget Area

Top Diagrams

  • Financial Ratio Analysis Financial Ratio Analysis
  • Banking System Flowchart Banking System Flowchart
  • Kiribati GDP per capita Kiribati GDP per capita
  • piano chord chart Piano Chord Chart
  • Leadership pyramid leadership Leadership Pyramid Leadership
  • Sierra Leone GDP per capita Sierra Leone GDP per capita
  • European Union Structure Chart European Union Structure Chart
  • Asp Net Technology Stack Diagram ASP.NET Technology Stack Diagram
  • Business Strategy Mind Map Business Strategy Mind Map
  • Marketing and Sales Illustration Marketing And Sales Illustration
  • glass skyscraper glass skyscraper
  • Leader vs manager leader vs follower venn diagram Leader vs Manager
  • Nonprofit Operating Models Nonprofit Operating Models
  • Risk Management Process Diagram Risk Management Process Diagram
  • System Architecture Diagram Tool Online System Architecture Diagram Tool Online
  • Child Development – Baby Development Chart
  • Mens boxer briefs size chart Mens boxer briefs size chart
  • Porters five forces analysis for food manufacturers Porter’s Five Forces Analysis for Food Manufacturers
  • Agile scrum an overview on process and planning Agile scrum an overview on process and planning
  • Pounds to Kilograms – Kilograms to Pounds Chart

Latest Posts

  • System Architecture Diagram Tool Online
  • Kiribati GDP per capita
  • glass skyscraper
  • Simple Pendulum Diagram
  • Production Process Diagram
  • Cognitive Illustration
  • Aimultiple Digital Transformation Framework
  • Nonprofit Operating Models
  • Business Strategy Mind Map
  • Cloud Service Models Representation
  • Costa Rica GDP per capita
  • Risk Management Process Diagram
  • Evolution of the Digital Workplace
  • Using the Five Forces Model in Industry Analysis
  • Body Diagram Physics Explained

Top 20 Tags

  • size (30)
  • food (7)
  • food chart (7)
  • food diagram (7)
  • skin (6)
  • cities (6)
  • world (6)
  • population (6)
  • conversion (6)
  • cancer (5)
  • alcohol diagram (5)
  • business strategy diagram (5)
  • sales process diagram (5)
  • car diagram (4)
  • cloud computing diagram (4)
  • water cycle (4)
  • stress (4)
  • how stress affects body (4)
  • yoga (4)
  • yoga poses (4)

Category

  • Anatomy
  • Business
  • Cancer
  • Clothes
  • Economy
  • Energy
  • Food
  • General
  • Health
  • IT
  • Military
  • Science
  • Sign
  • Sizes
  • Stress
  • Tools
  • Top
  • Women & Men
  • Workout
Copyright © 2026 Charts | Diagrams | Graphs. All Rights Reserved.
Theme: Catch Box by Catch Themes
Scroll Up