
Author Archives: chartdiagram

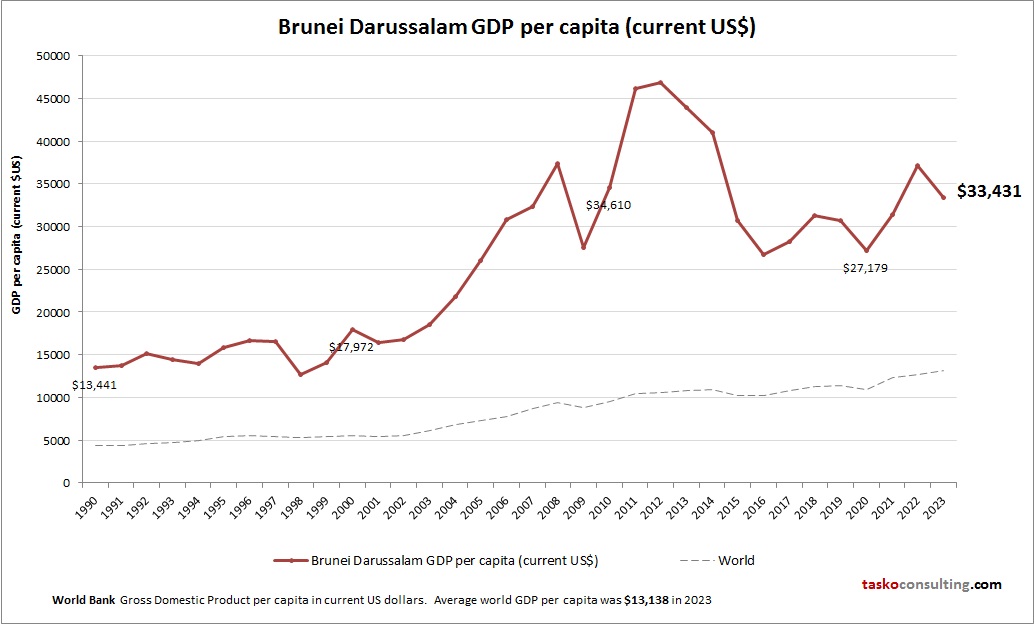
Brunei Darussalam GDP per capita

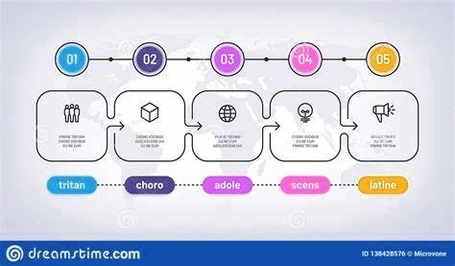
Speed Up Internal Process


Cloud Computing Architecture: Cloud computing architecture refers to the components and subcomponents required for cloud computing. It includes front-end platforms, back-end platforms, cloud-based delivery, and a network. This architecture enables scalable, flexible, and cost-effective IT solutions.
Regenerative Agriculture Infographic


Regenerative agriculture is a farming practice that focuses on improving the health of soil, which has been degraded by intensive farming. It is a holistic approach that aims to rehabilitate and enhance the entire ecosystem of the farm. The practice places a heavy premium on soil health with attention also paid to water management, fertilizer use, and more . Regenerative agriculture is based on the principle that the soil is Continue reading Regenerative Agriculture Infographic
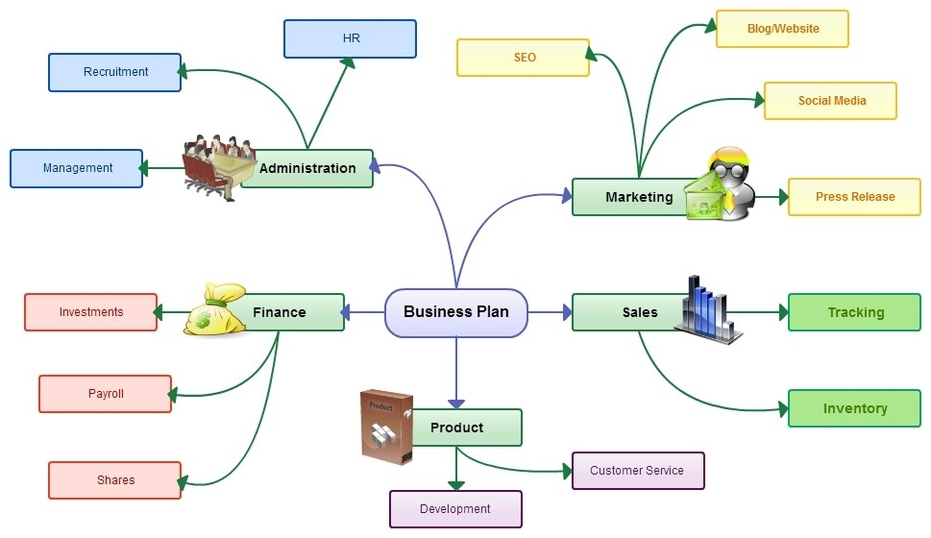
Business Mind Map

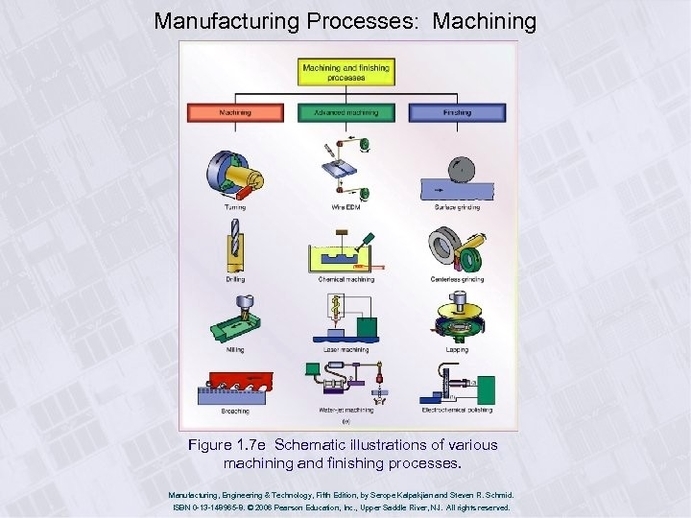
Manufacturing Processes Engineering

People Process Technology Elements for Successful Change Management PPT
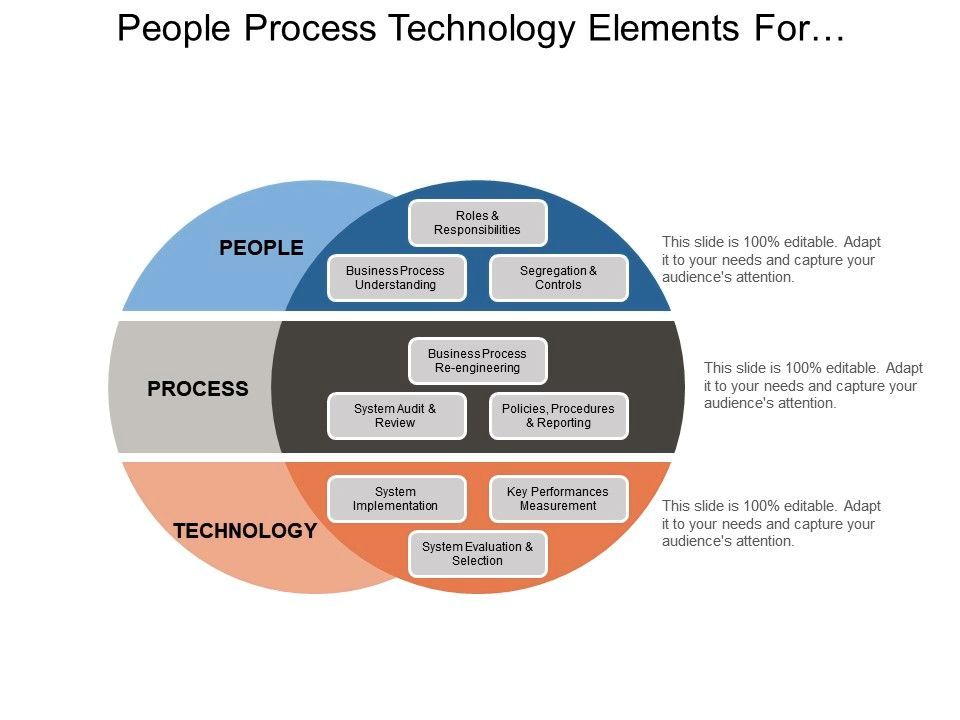

People Process Technology Elements for Successful Change Management PPT: The People Process Technology (PPT) framework is a powerful tool for driving successful change management initiatives. It emphasizes the importance of aligning people (employees), processes (workflows), and technology (tools and systems) to facilitate effective change. By focusing on these three elements, organizations can ensure smoother transitions and greater acceptance of change across all levels.
Business Strategy Framework Powerpoint Template
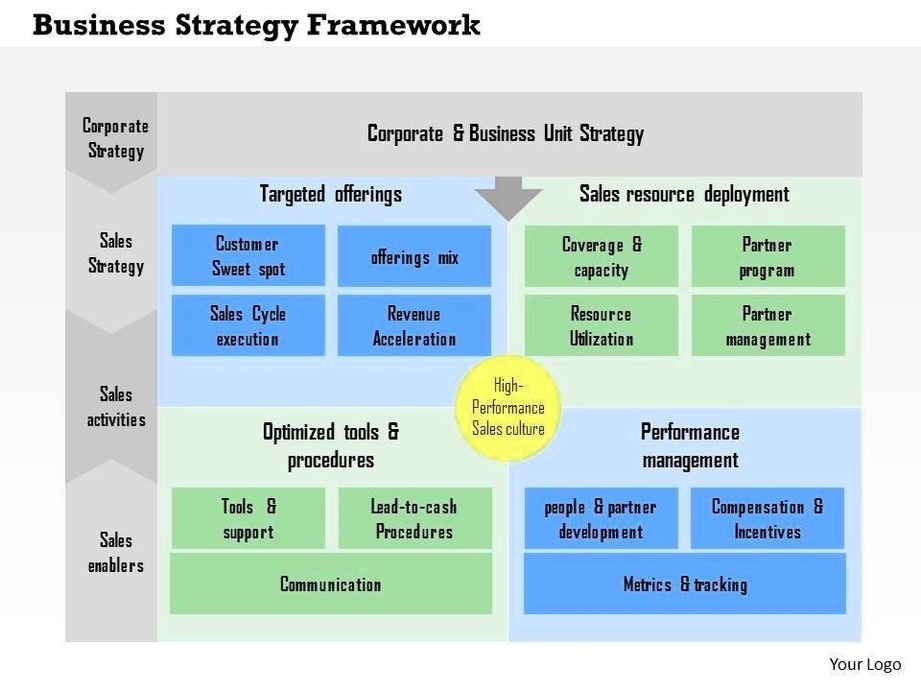

Business Strategy Framework PowerPoint Template: A Business Strategy Framework PowerPoint Template is a pre-designed presentation tool that includes various frameworks, such as timelines, graphs, tables, and diagrams. It helps in explaining business strategies and processes in a detailed and professional manner13.
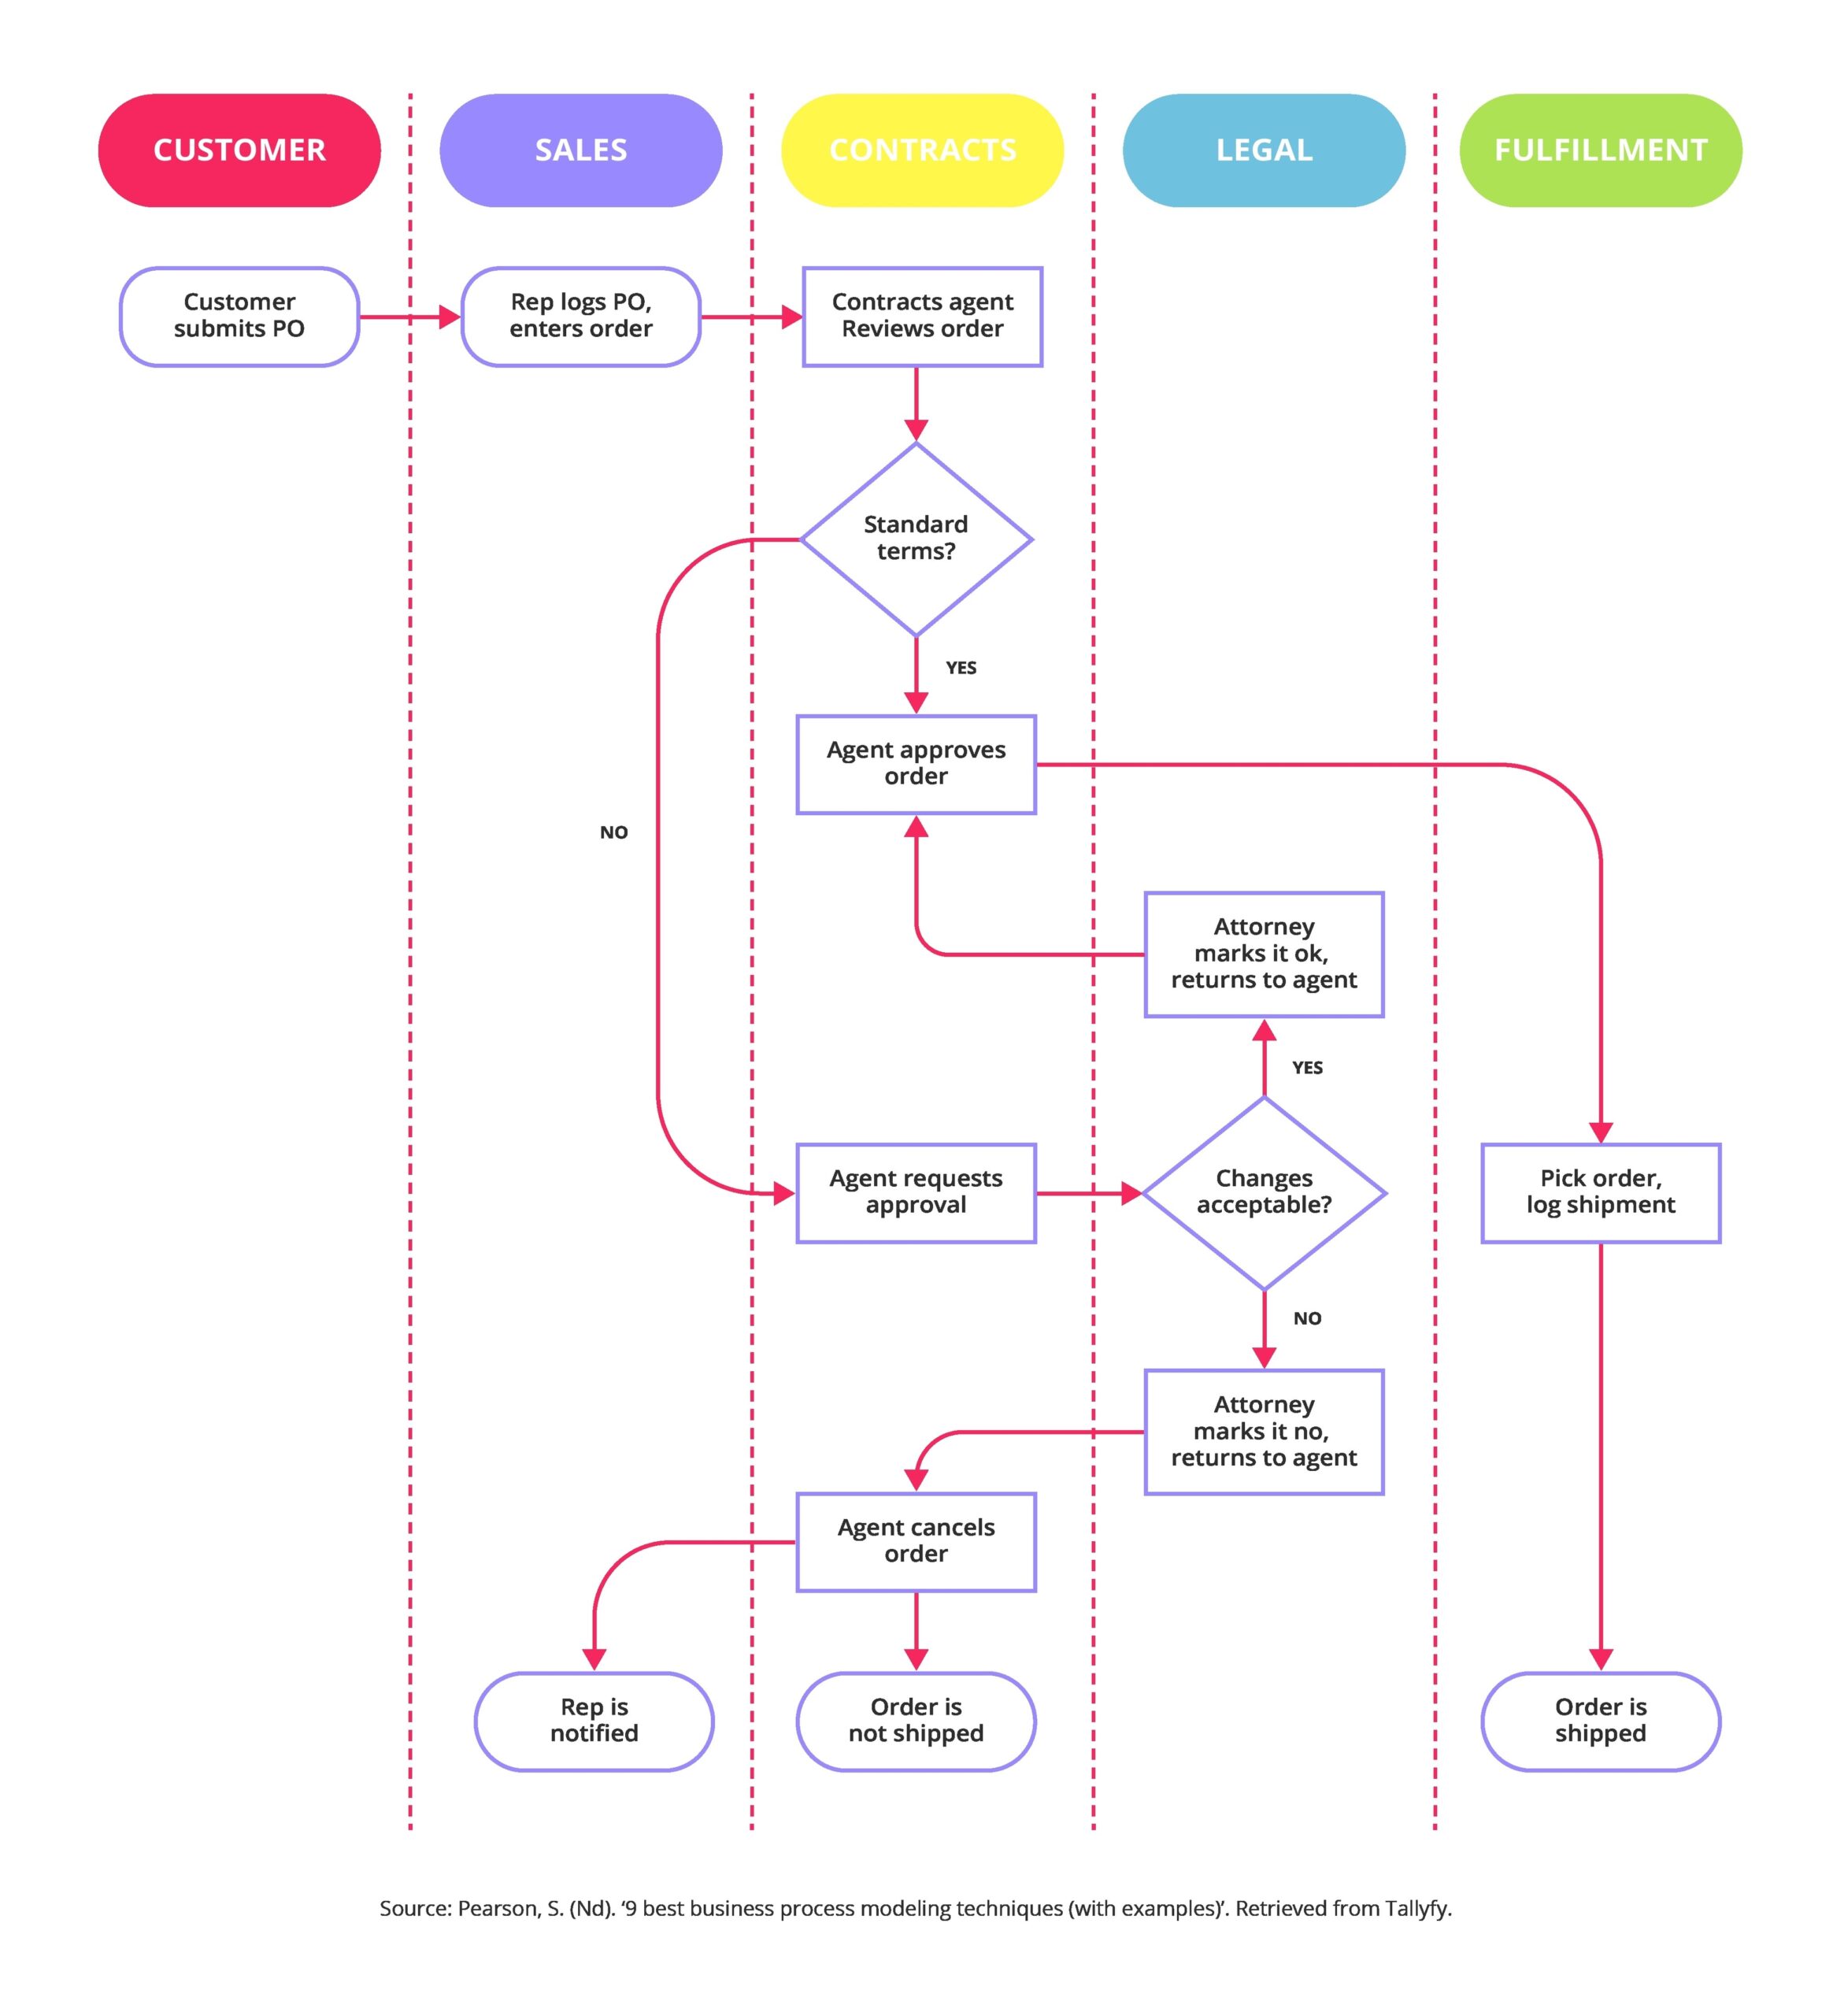
Business Process Modelling Techniques

Hub And Spoke Model
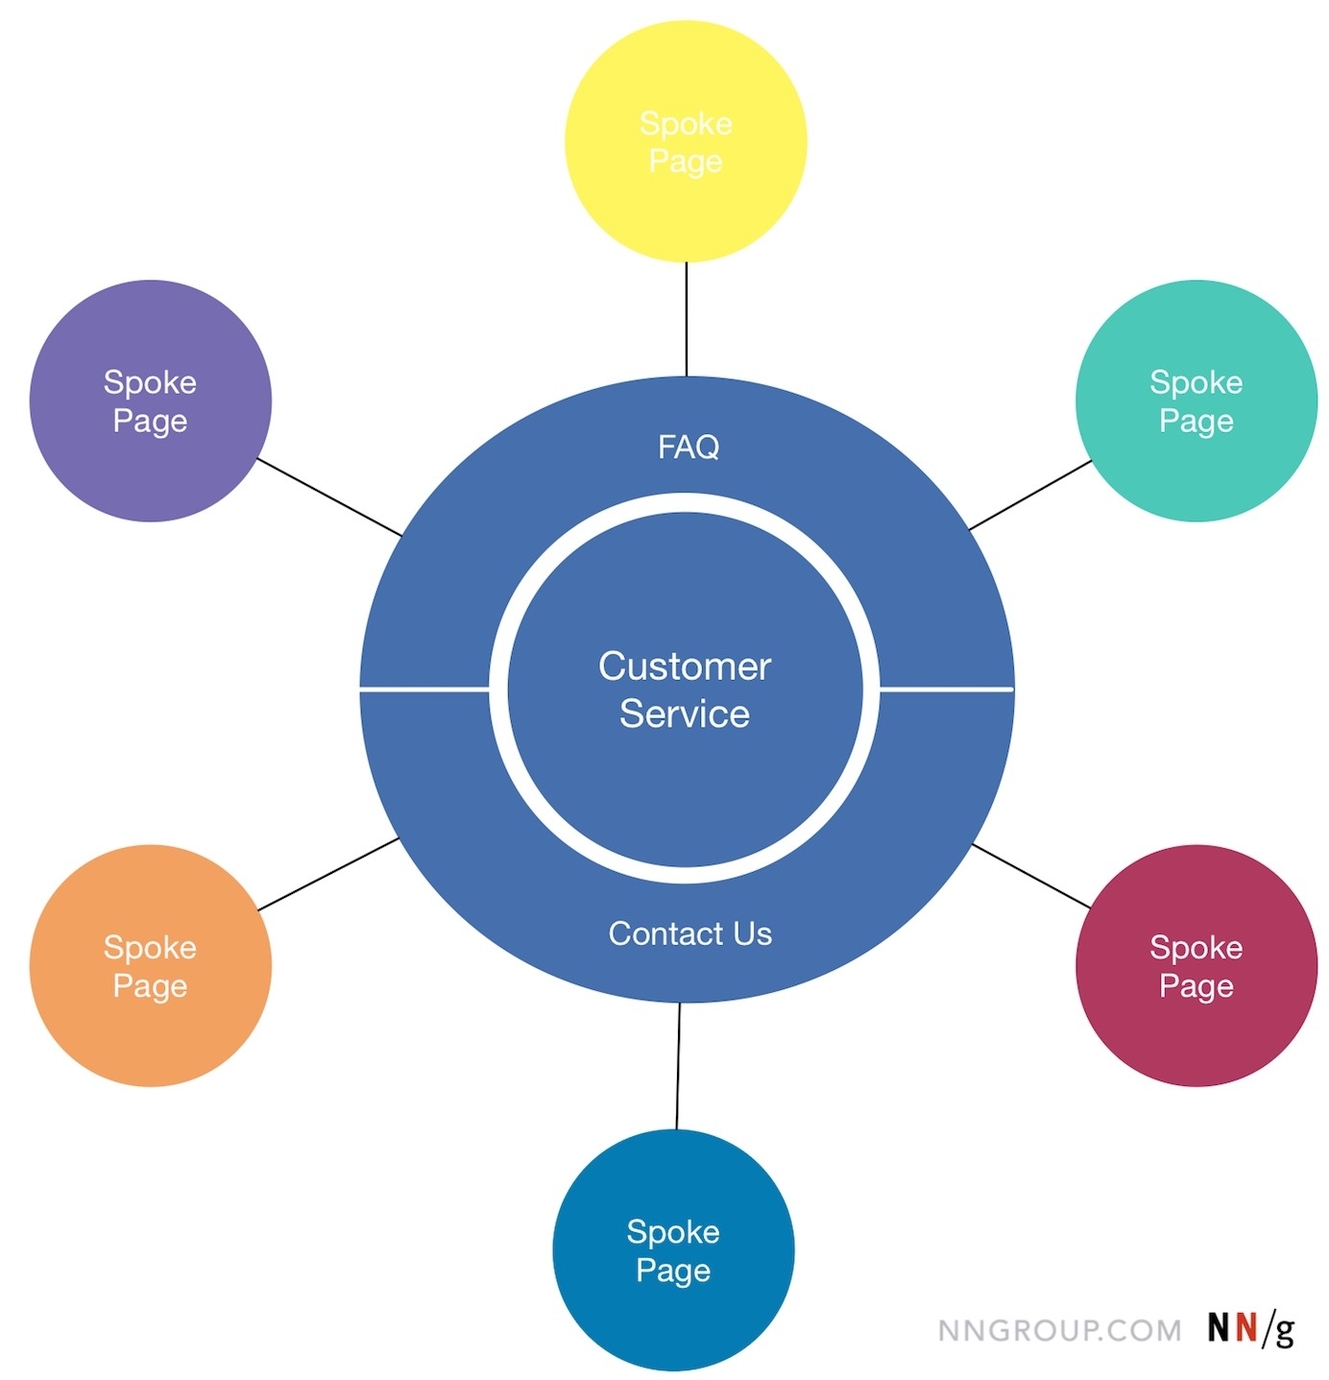

Hub And Spoke Model: The Hub and Spoke Model is a system where a central hub connects to various satellite nodes (spokes) that rely on the hub for coordination and resources. In business, this model is commonly used in logistics, transportation, and communication networks. It ensures efficiency by consolidating resources, reducing redundancy, and streamlining operations.