Latvia GDP per capita
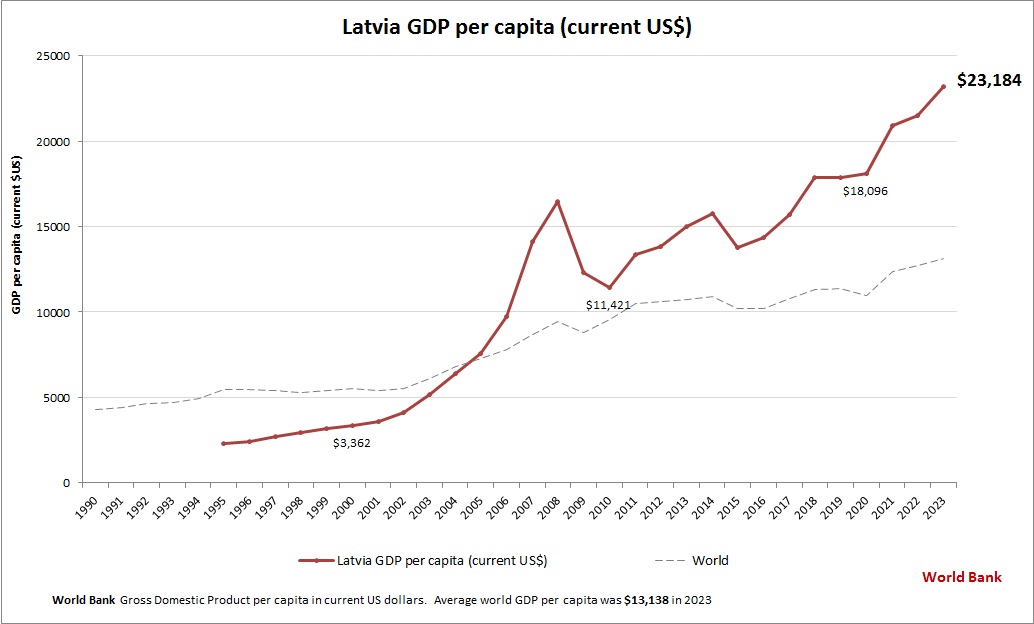
This diagram presents Latvia GDP per capita. World Bank is the source of this economic data. Latest GDP per person information for Latvia.

Charts | Diagrams | Graphs
This diagram presents Latvia GDP per capita. World Bank is the source of this economic data. Latest GDP per person information for Latvia.
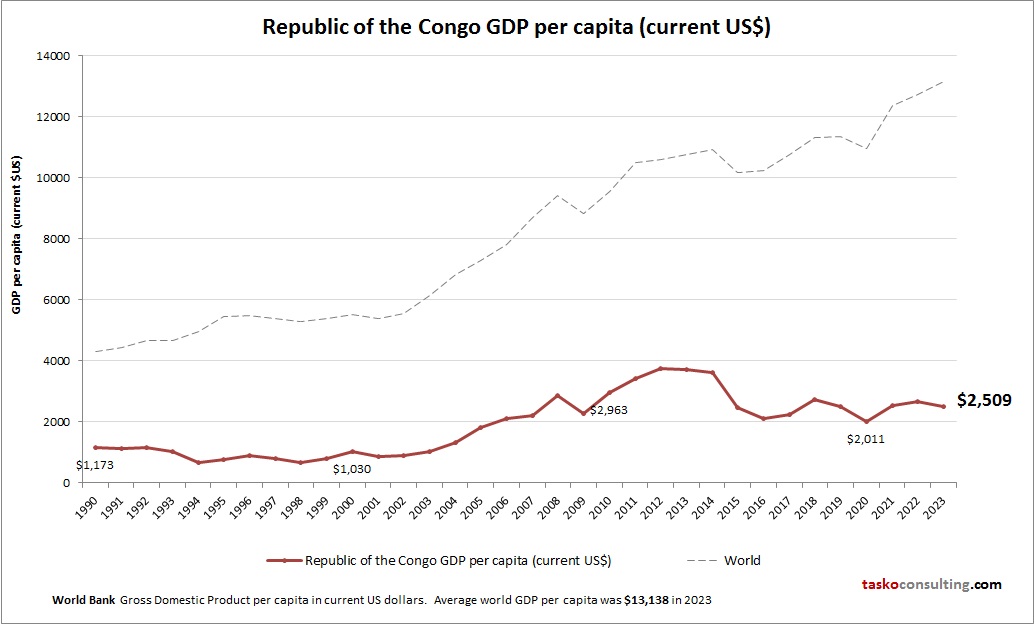
This diagram presents Republic of the Congo GDP per capita. World Bank is the source of this economic data. Based on the latest available information for Republic of the Congo.
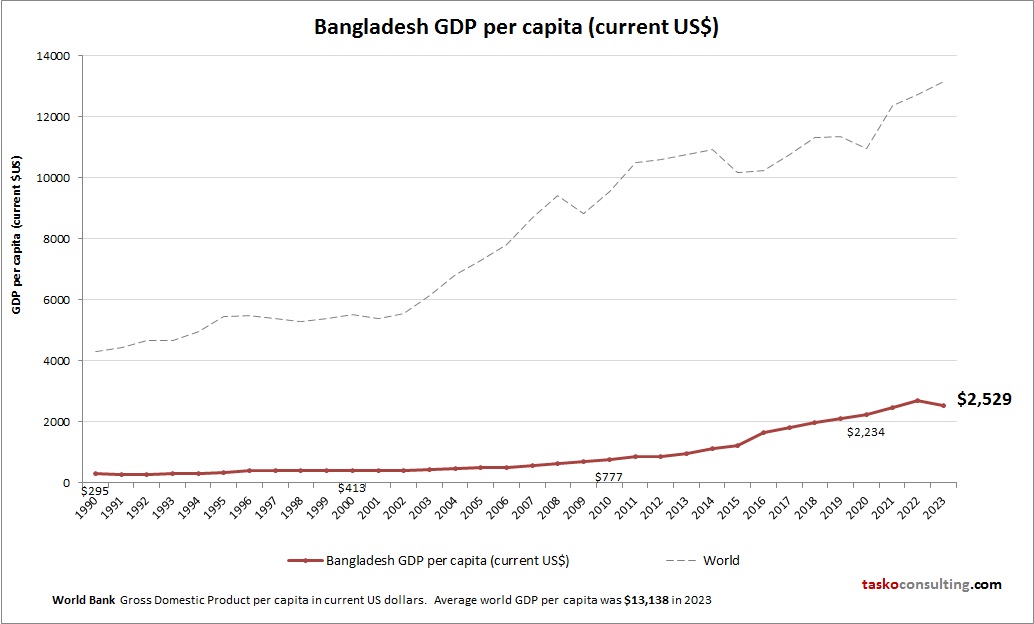
This diagram presents Bangladesh GDP per capita. The gross domestic product statistics are compiled by World Bank. Based on the latest available information for Bangladesh.
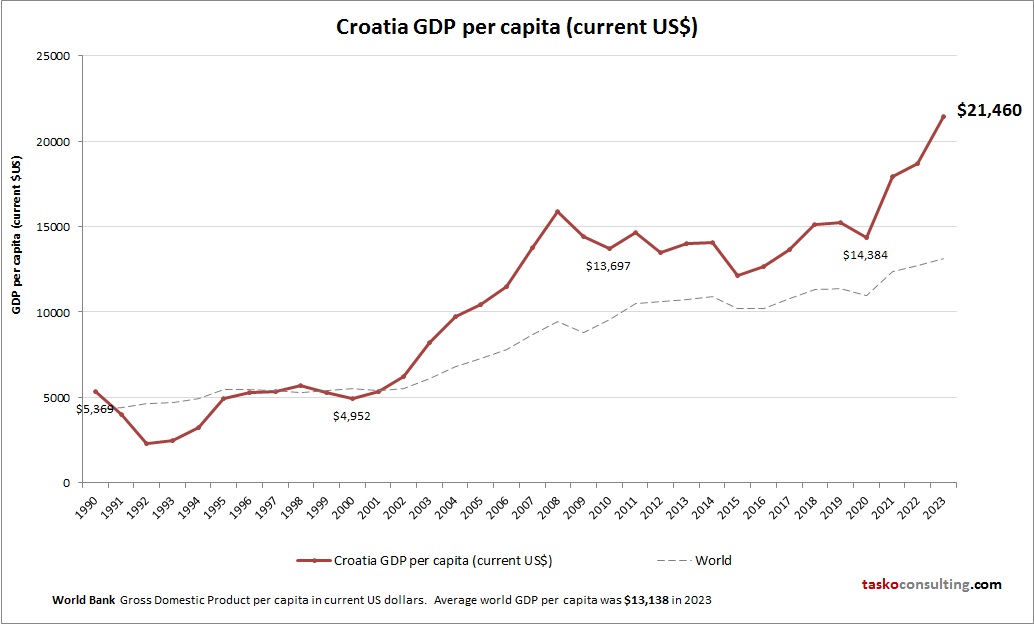
This graph shows Croatia GDP per capita. This is according to World Bank GDP stats by country. Based on the latest available information for Croatia.

This chart demonstrates Gibraltar GDP per capita. World Bank is the source of this economic data. Latest GDP per person information for Gibraltar.

This diagram presents Spain GDP per capita. The gross domestic product statistics are compiled by World Bank. Based on the latest economic info provided for Spain.

This chart demonstrates Pre demographic dividend GDP per capita. World Bank is the source of this economic data. Based on the latest economic info provided for Pre demographic dividend.

This chart demonstrates Nepal GDP per capita. The gross domestic product statistics are compiled by World Bank. Latest GDP per person information for Nepal.

This chart demonstrates Jordan GDP per capita. World Bank is the source of this economic data. Latest GDP per person information for Jordan.

This diagram presents Puerto Rico GDP per capita. World Bank is the source of this economic data. Latest GDP per person information for Puerto Rico.