Skip to content
Charts | Diagrams | Graphs
Charts | Diagrams | Graphs
Menu
Primary menu
Top
General
Upload Diagram
Sign
Business
Economy
Sizes
Anatomy
Health
Workout
Food
Stress
Cancer
IT
Science
Energy
Women & Men
Clothes
Military
Tools
Tag Archives:
live
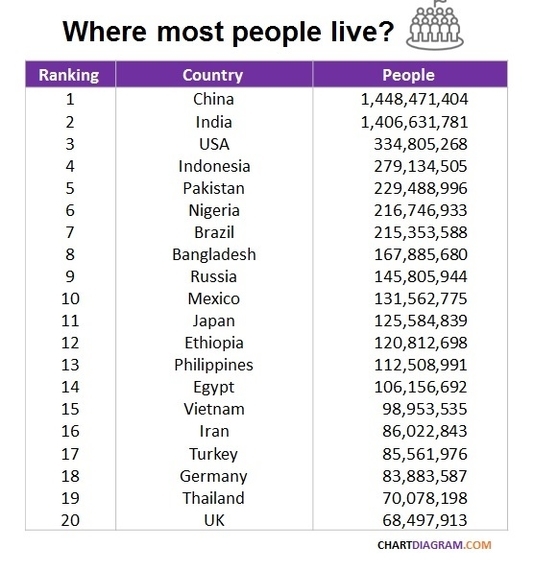
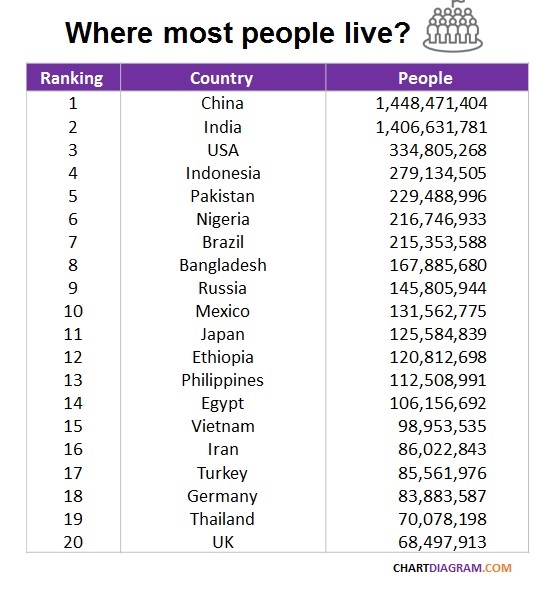
Where most people live
Posted on
June 15, 2022
by
chartdiagram
Where most people live
Posted on
June 15, 2022
by
chartdiagram
Scroll Up