Skip to content
cropped cropped chart diagram1 2.png

Charts | Diagrams | Graphs

Charts | Diagrams | Graphs

Menu

Primary menu

  • Top
  • General
    • Upload Diagram
    • Sign
  • Business
  • Economy
  • Sizes
  • Anatomy
  • Health
    • Workout
    • Food
    • Stress
    • Cancer
  • IT
  • Science
    • Energy
  • Women & Men
    • Clothes
    • Military
    • Tools

Category Archives: Economy

Economy diagrams focused on various countries GDP (size of the economy), GDP per capita, purchasing power parity and other key economic measures. Data provided by Economy Diagrams

Slovenia GDP per capita

Posted on December 10, 2025 by chartdiagram
Slovenia GDP per capita

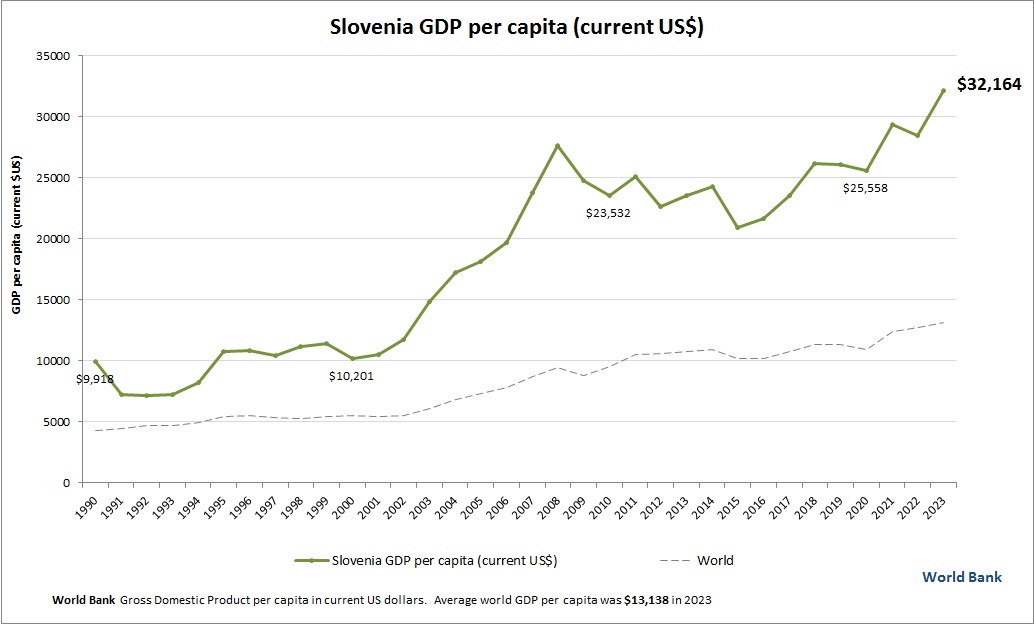
This chart demonstrates Slovenia GDP per capita. World Bank is the source of this economic data. Based on the latest economic info provided for Slovenia.

Posted in Economy | Tagged Slovenia data, Slovenia economy, Slovenia GDP per person, Slovenia gross domestic product per capita, Slovenia statistics

Maldives GDP per capita

Posted on November 23, 2025 by chartdiagram
Maldives GDP per capita

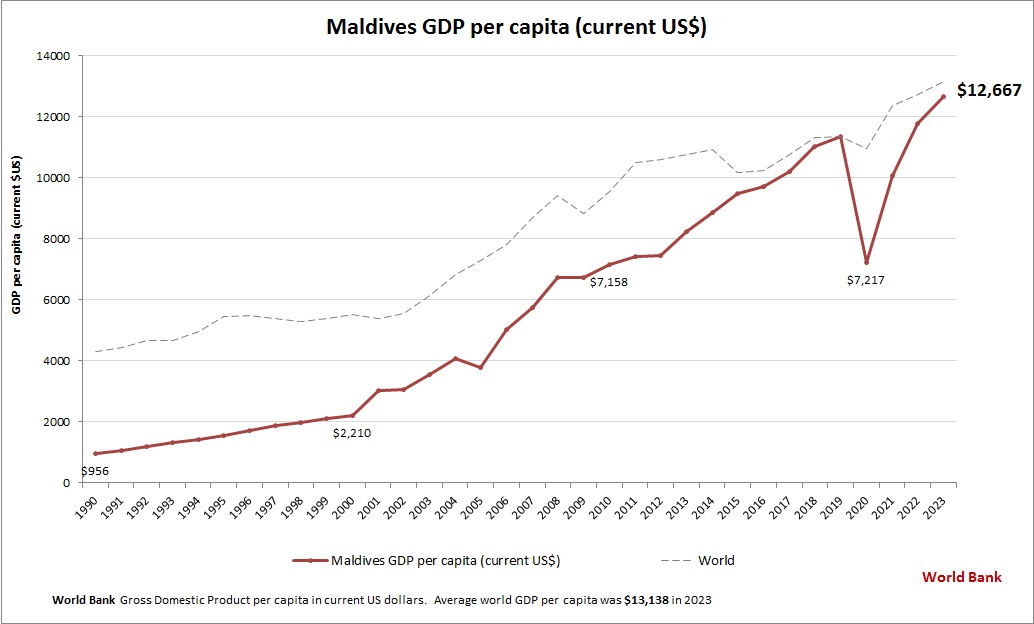
This graph shows Maldives GDP per capita. This is according to World Bank GDP stats by country. Latest GDP per person information for Maldives.

Posted in Economy | Tagged Maldives data, Maldives economy, Maldives GDP per person, Maldives gross domestic product per capita, Maldives statistics

Bahamas GDP per capita

Posted on November 14, 2025 by chartdiagram
Bahamas GDP per capita

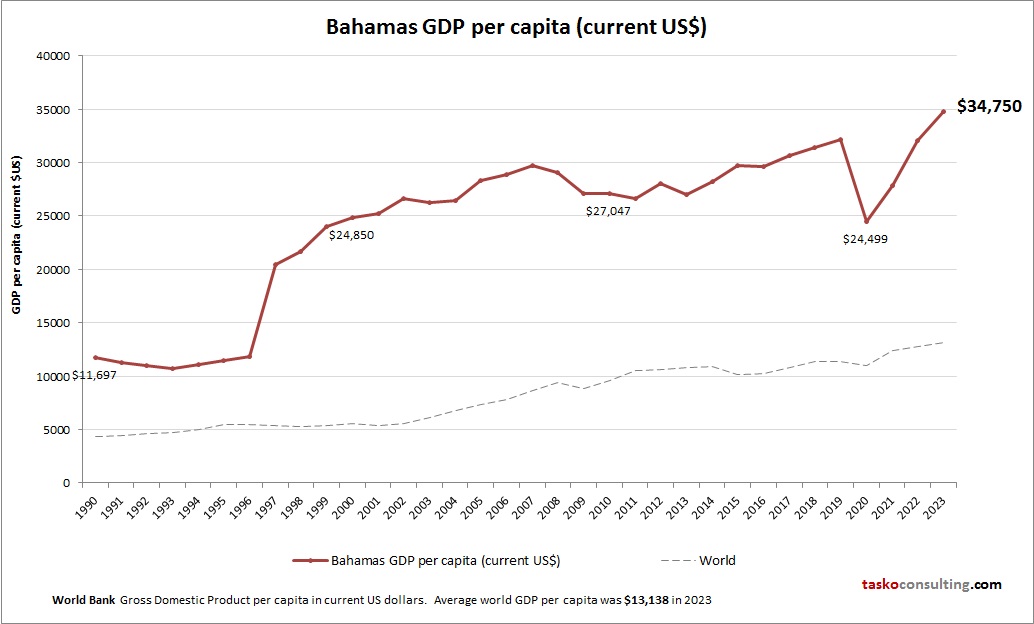
This graph shows Bahamas GDP per capita. World Bank is the source of this economic data. Based on the latest available information for Bahamas.

Posted in Economy | Tagged Bahamas data, Bahamas economy, Bahamas GDP per person, Bahamas gross domestic product per capita, Bahamas statistics

El Salvador GDP per capita

Posted on November 12, 2025 by chartdiagram
El Salvador GDP per capita

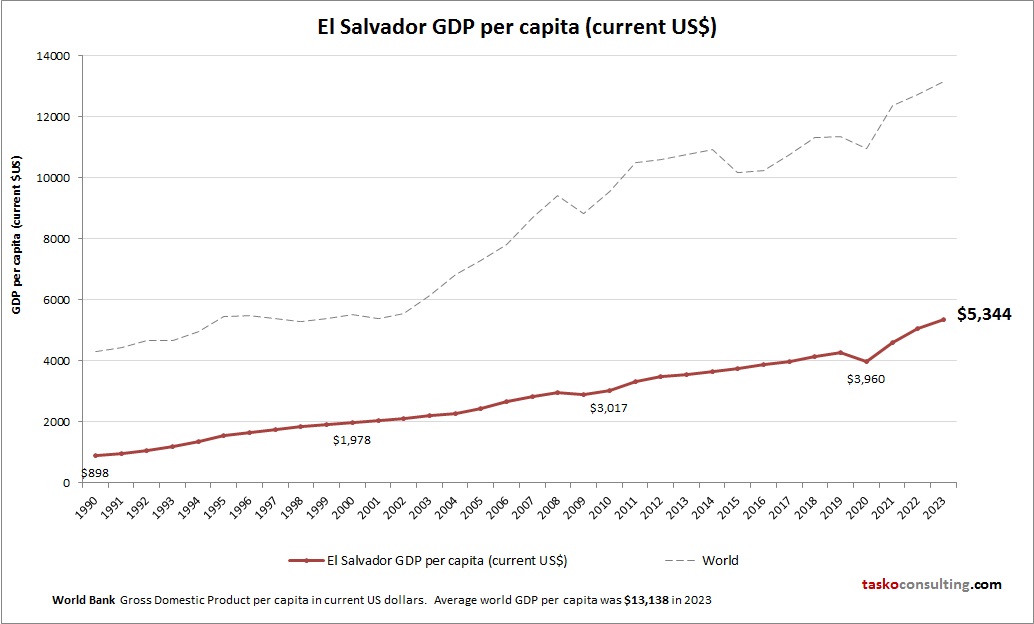
This diagram presents El Salvador GDP per capita. This is according to World Bank GDP stats by country. Latest GDP per person information for El Salvador.

Posted in Economy | Tagged El Salvador data, El Salvador economy, El Salvador GDP per person, El Salvador gross domestic product per capita, El Salvador statistics

Zambia GDP per capita

Posted on November 11, 2025 by chartdiagram
Zambia GDP per capita

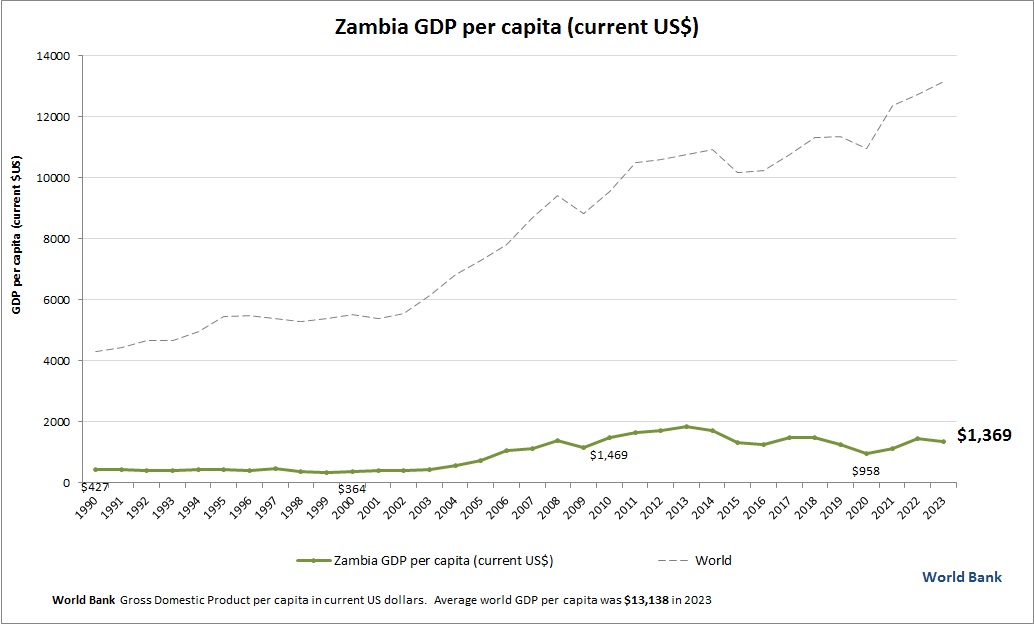
This graph shows Zambia GDP per capita. World Bank is the source of this economic data. Based on the latest available information for Zambia.

Posted in Economy | Tagged Zambia data, Zambia economy, Zambia GDP per person, Zambia gross domestic product per capita, Zambia statistics

Mauritius GDP per capita

Posted on November 9, 2025 by chartdiagram
Mauritius GDP per capita

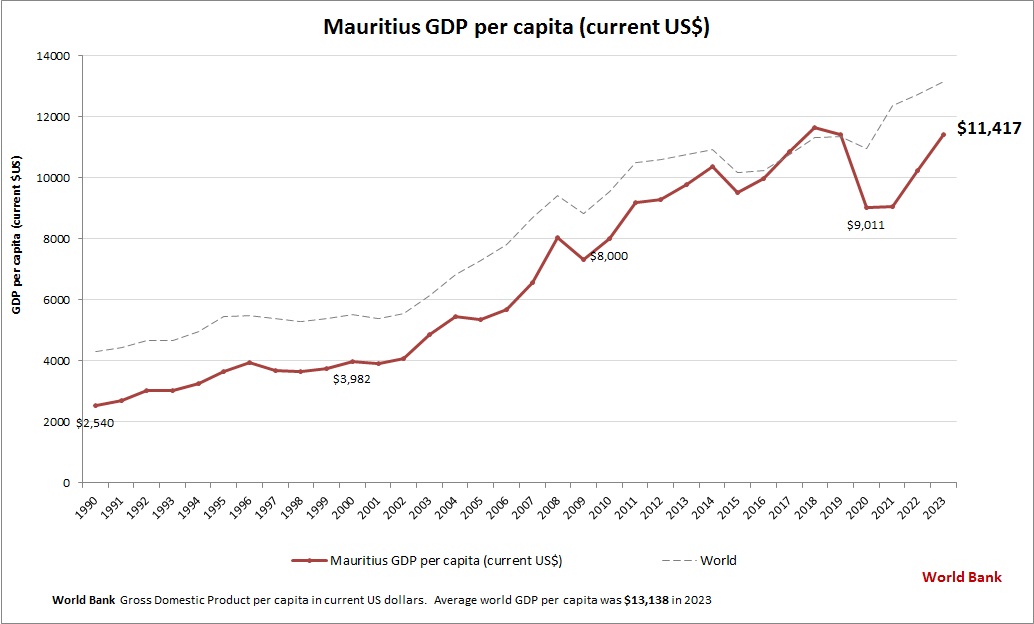
This graph shows Mauritius GDP per capita. World Bank is the source of this economic data. Latest GDP per person information for Mauritius.

Posted in Economy | Tagged Mauritius data, Mauritius economy, Mauritius GDP per person, Mauritius gross domestic product per capita, Mauritius statistics

Finland GDP per capita

Posted on November 6, 2025 by chartdiagram
Finland GDP per capita

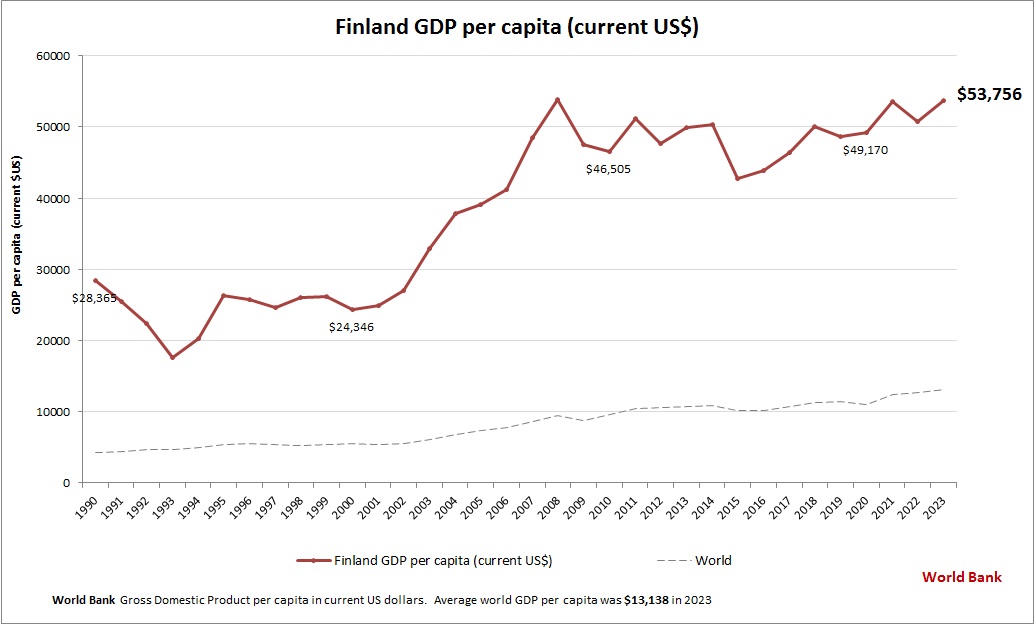
This chart demonstrates Finland GDP per capita. This is according to World Bank GDP stats by country. Based on the latest available information for Finland.

Posted in Economy | Tagged Finland data, Finland economy, Finland GDP per person, Finland gross domestic product per capita, Finland statistics

Guatemala GDP per capita

Posted on November 4, 2025 by chartdiagram
Guatemala GDP per capita

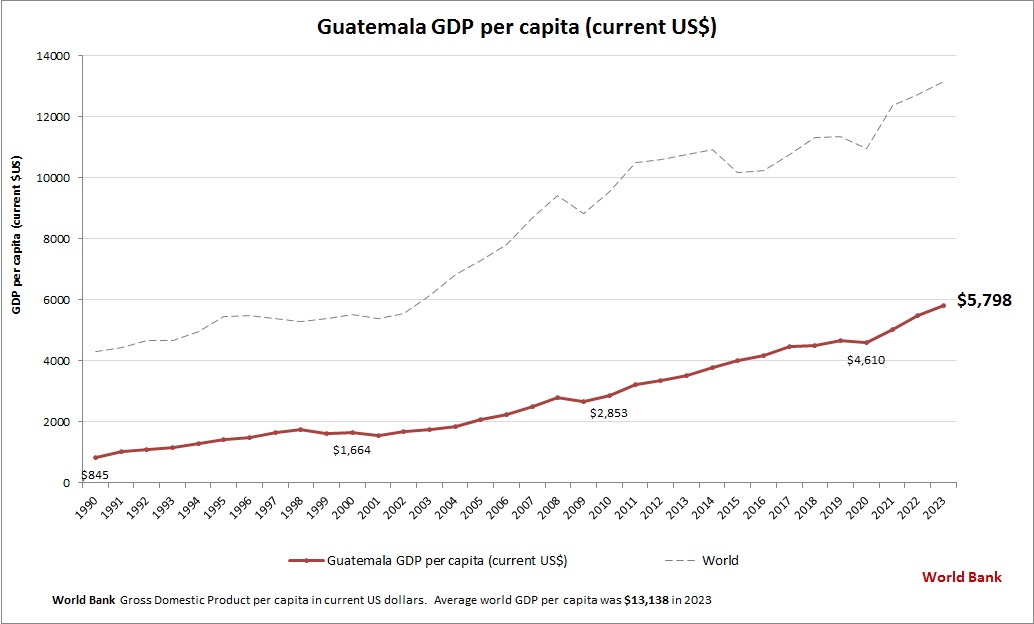
This graph shows Guatemala GDP per capita. World Bank is the source of this economic data. Based on the latest economic info provided for Guatemala.

Posted in Economy | Tagged Guatemala data, Guatemala economy, Guatemala GDP per person, Guatemala gross domestic product per capita, Guatemala statistics

Cuba GDP per capita

Posted on November 3, 2025 by chartdiagram
Cuba GDP per capita

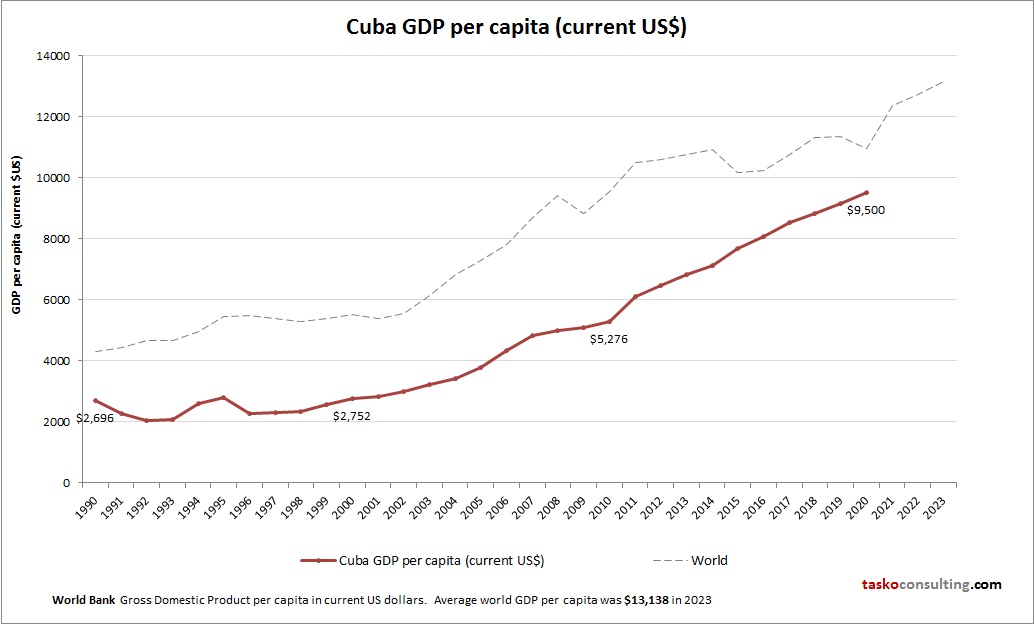
This graph shows Cuba GDP per capita. The gross domestic product statistics are compiled by World Bank. Based on the latest available information for Cuba.

Posted in Economy | Tagged Cuba data, Cuba economy, Cuba GDP per person, Cuba gross domestic product per capita, Cuba statistics

Gabon GDP per capita

Posted on October 31, 2025 by chartdiagram
Gabon GDP per capita

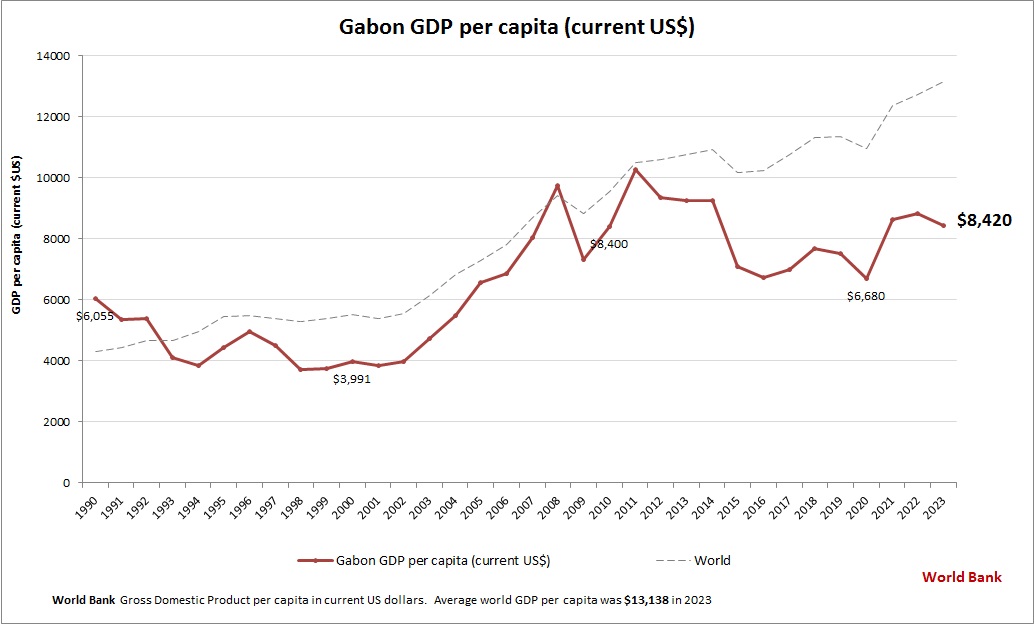
This graph shows Gabon GDP per capita. World Bank is the source of this economic data. Based on the latest available information for Gabon.

Posted in Economy | Tagged Gabon data, Gabon economy, Gabon GDP per person, Gabon gross domestic product per capita, Gabon statistics

Post navigation

← Older posts
Newer posts →

Primary Sidebar Widget Area

Top Diagrams

  • obesity chart Obesity Chart

  • Hand tools diagram Hand tools diagram

  • piano chord chart Piano Chord Chart

  • Women's Clothing Size Chart Women’s Clothing Size Chart

  • Baby Month by Month – Pregnancy Stages

  • blood flow diagram Blood Flow Diagram

  • Hub And Spoke Model Hub And Spoke Model

  • Fastener size chart Fastener size chart

  • Capsule sizes chart Capsule sizes chart

  • Customer Self Service Customer Self Service

  • circulatory system Circulatory System

  • Transformational leadership model Transformational Leadership Model

  • Pestel analysis powerpoint template Pestel analysis powerpoint template

  • Best Yoga Exercises Best Yoga Exercises

  • Cell Diagram

  • Atom Diagram

  • Blood Pressure By Age Blood Pressure By Age

  • Color symbolism chart Color symbolism chart

  • Agile model of software development the development cycle Agile Model of Software Development the Development Cycle

  • frame size seat height chart Bike Frame Size and Seat Height Chart

Latest Posts

  • Hub And Spoke Model
  • Leadership skills business diagram stock
  • Libya GDP per capita
  • Marketing Strategy Diagram
  • Strategic Planning Definition
  • Pestel analysis powerpoint template
  • How agile changed software development
  • Customer Self Service
  • Senegal GDP per capita
  • Computer Science Diagram Examined
  • Business Analysis Competency Model
  • Iraq GDP per capita
  • Marketing And Sales Organization Chart
  • What is agile methodology and how can it help your online shop
  • Enterprise Architecture Blueprint Hospital

Top 20 Tags

  • size (30)
  • food (7)
  • food chart (7)
  • food diagram (7)
  • skin (6)
  • cities (6)
  • world (6)
  • population (6)
  • conversion (6)
  • cancer (5)
  • alcohol diagram (5)
  • sales process diagram (5)
  • car diagram (4)
  • water cycle (4)
  • stress (4)
  • how stress affects body (4)
  • yoga (4)
  • yoga poses (4)
  • yoga workout (4)
  • best yoga (4)

Category

  • Anatomy
  • Business
  • Cancer
  • Clothes
  • Economy
  • Energy
  • Food
  • General
  • Health
  • IT
  • Military
  • Science
  • Sign
  • Sizes
  • Stress
  • Tools
  • Top
  • Women & Men
  • Workout
Copyright © 2026 Charts | Diagrams | Graphs. All Rights Reserved.
Theme: Catch Box by Catch Themes
Scroll Up