Panama GDP per capita
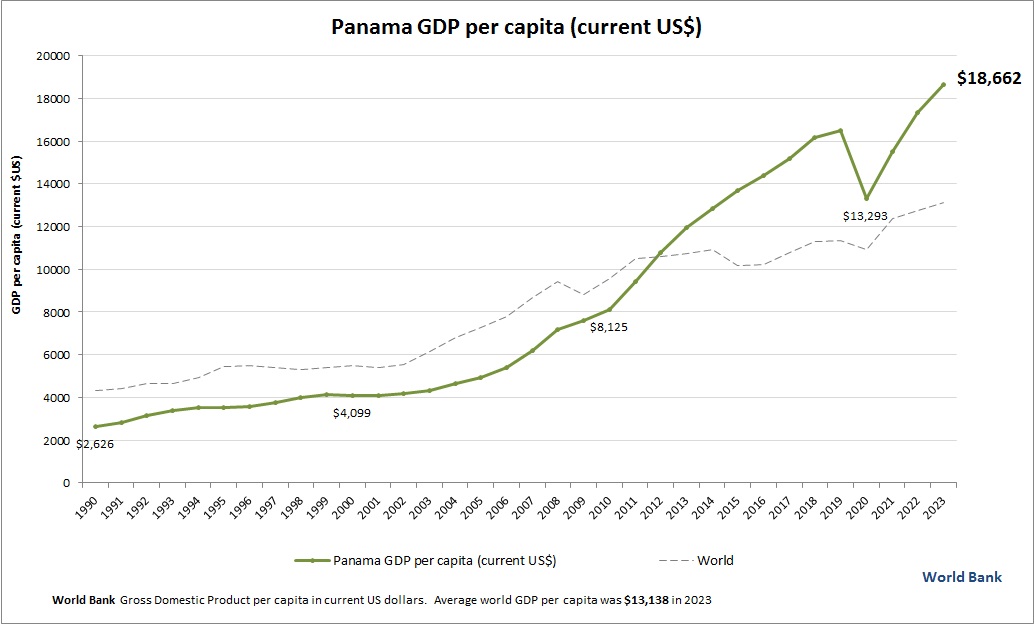
This chart demonstrates Panama GDP per capita. The gross domestic product statistics are compiled by World Bank. Based on the latest economic info provided for Panama.

Charts | Diagrams | Graphs
This chart demonstrates Panama GDP per capita. The gross domestic product statistics are compiled by World Bank. Based on the latest economic info provided for Panama.
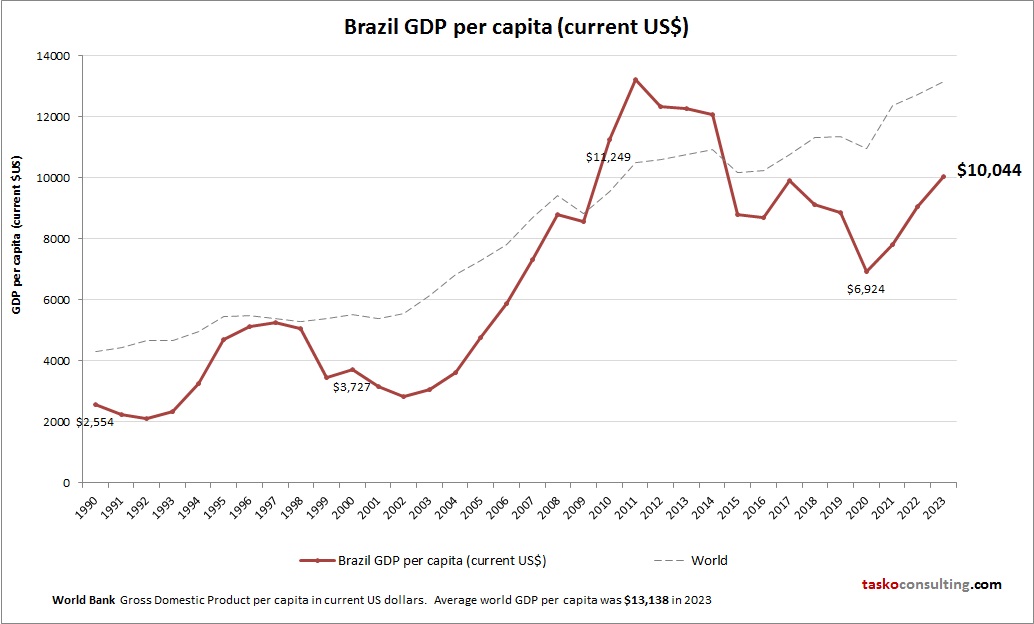
This chart demonstrates Brazil GDP per capita. This is according to World Bank GDP stats by country. Based on the latest economic info provided for Brazil.
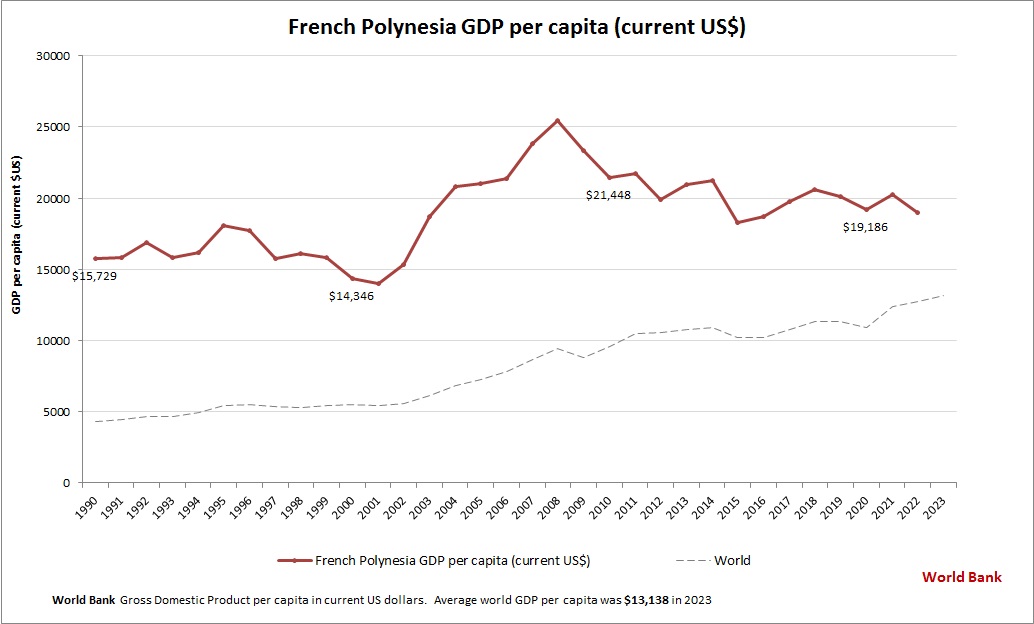
This chart demonstrates French Polynesia GDP per capita. The gross domestic product statistics are compiled by World Bank. Based on the latest available information for French Polynesia.
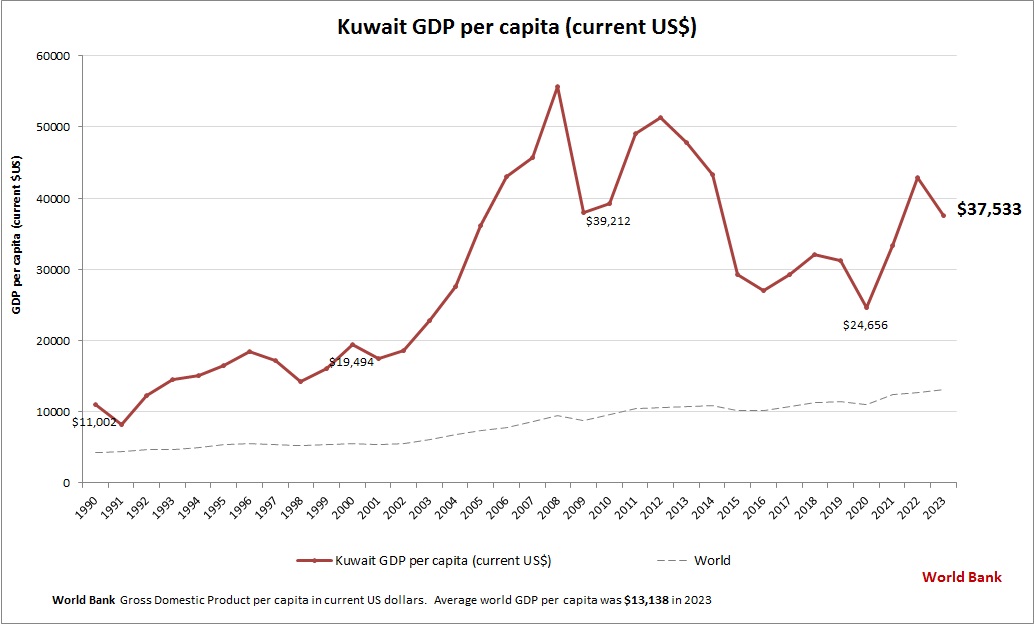
This chart demonstrates Kuwait GDP per capita. World Bank is the source of this economic data. Latest GDP per person information for Kuwait.
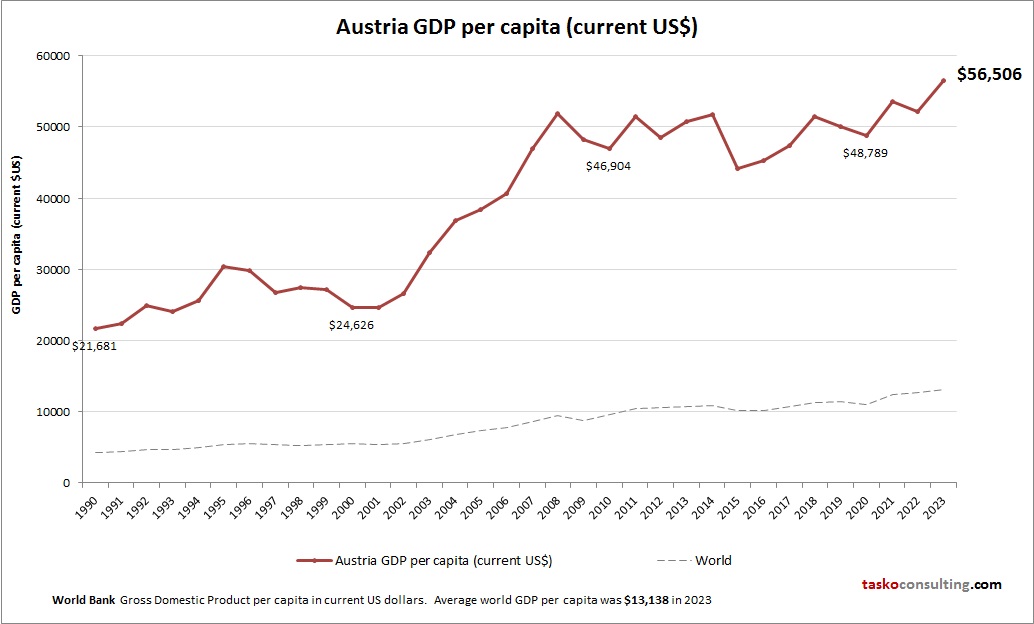
This diagram presents Austria GDP per capita. World Bank is the source of this economic data. Based on the latest economic info provided for Austria.
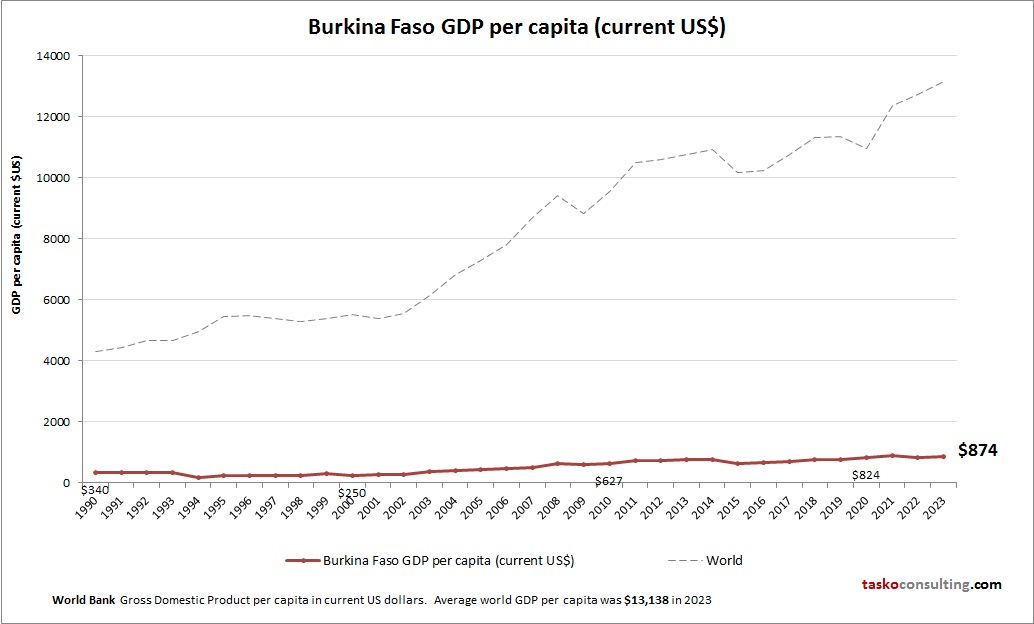
This chart demonstrates Burkina Faso GDP per capita. The gross domestic product statistics are compiled by World Bank. Based on the latest economic info provided for Burkina Faso.
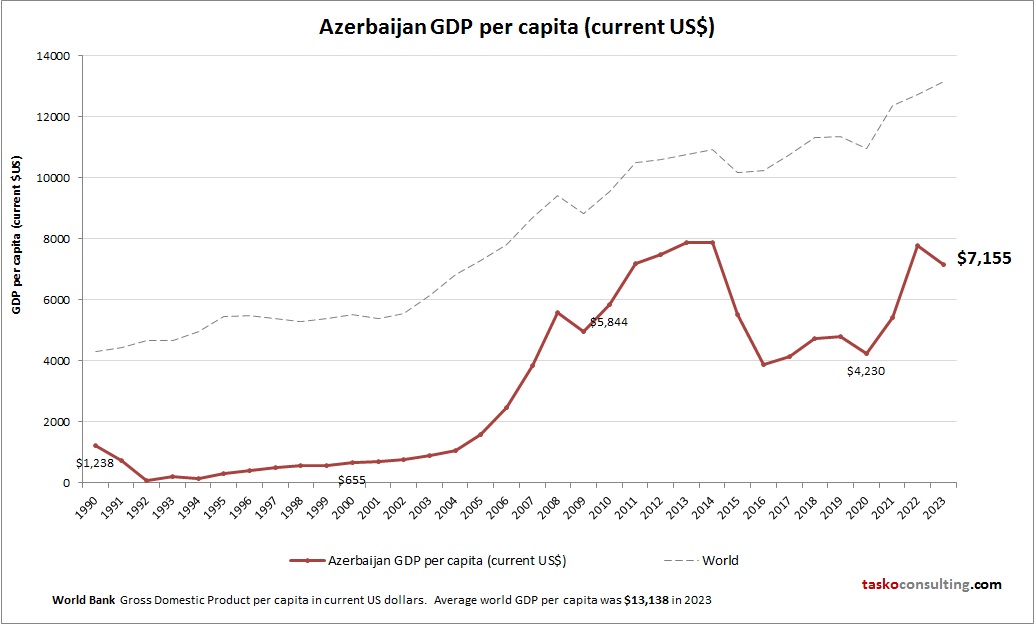
This graph shows Azerbaijan GDP per capita. World Bank is the source of this economic data. Latest GDP per person information for Azerbaijan.
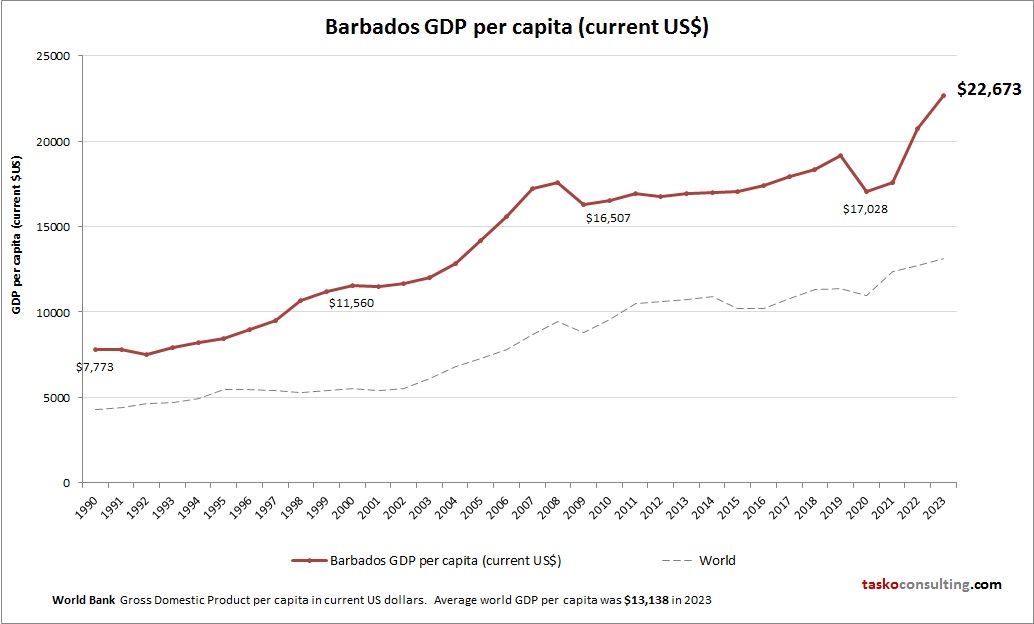
This graph shows Barbados GDP per capita. World Bank is the source of this economic data. Based on the latest economic info provided for Barbados.
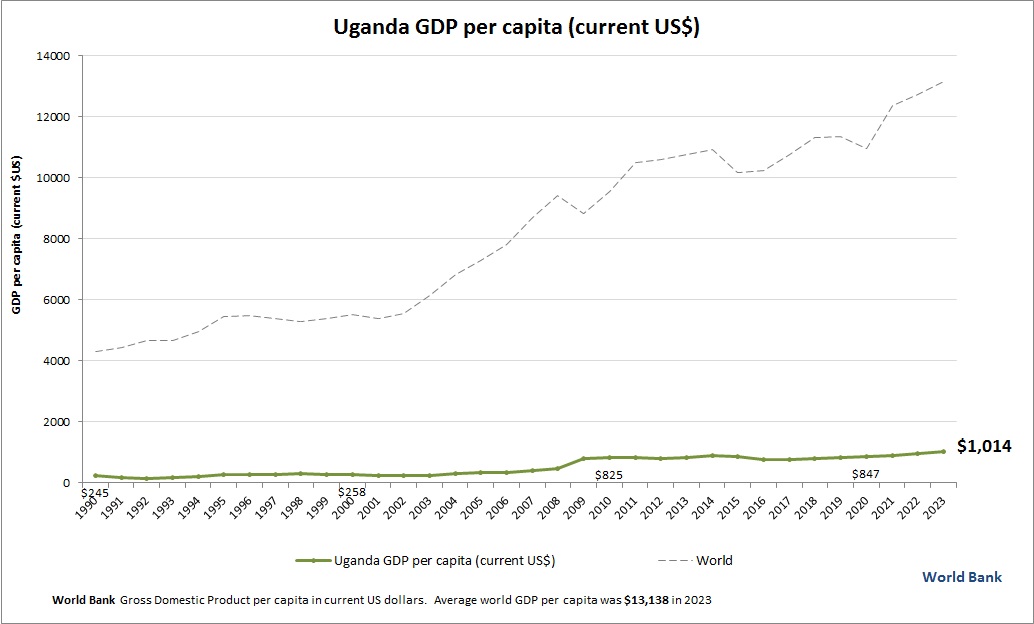
This diagram presents Uganda GDP per capita. This is according to World Bank GDP stats by country. Latest GDP per person information for Uganda.
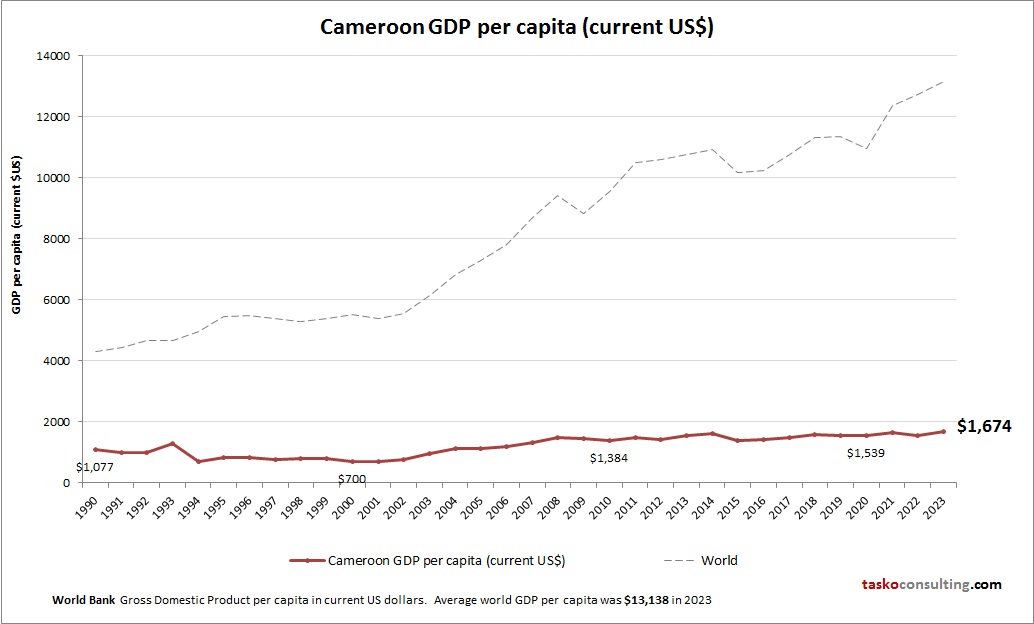
This chart demonstrates Cameroon GDP per capita. World Bank is the source of this economic data. Latest GDP per person information for Cameroon.