United Kingdom GDP per capita

This chart demonstrates United Kingdom GDP per capita. World Bank is the source of this economic data. Latest GDP per person information for United Kingdom.

Charts | Diagrams | Graphs
This chart demonstrates United Kingdom GDP per capita. World Bank is the source of this economic data. Latest GDP per person information for United Kingdom.

This graph shows Myanmar GDP per capita. World Bank is the source of this economic data. Latest GDP per person information for Myanmar.

This graph shows Tunisia GDP per capita. World Bank is the source of this economic data. Based on the latest economic info provided for Tunisia.

This chart demonstrates Curacao GDP per capita. World Bank is the source of this economic data. Based on the latest economic info provided for Curacao.

This diagram presents Sri Lanka GDP per capita. The gross domestic product statistics are compiled by World Bank. Latest GDP per person information for Sri Lanka.
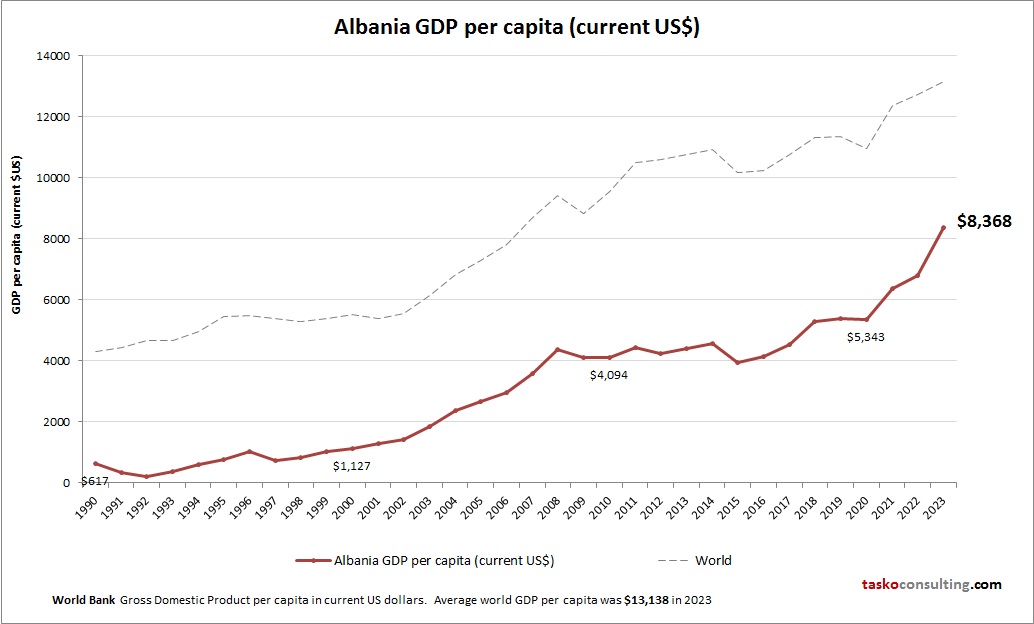
This diagram presents Albania GDP per capita. World Bank is the source of this economic data. Based on the latest economic info provided for Albania.
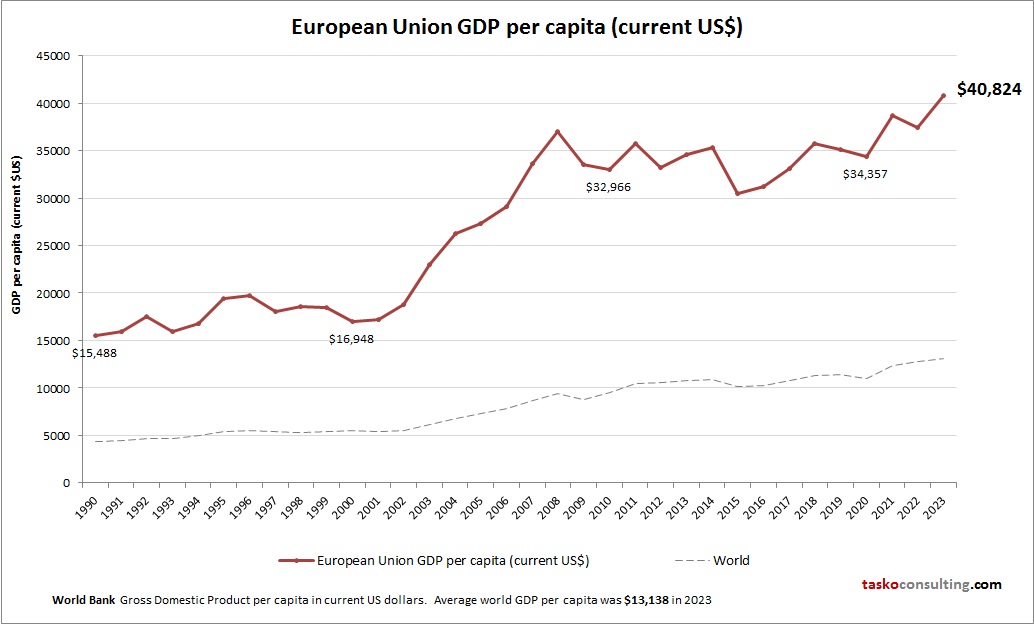
This chart demonstrates European Union GDP per capita. World Bank is the source of this economic data. Based on the latest economic info provided for European Union.

This chart demonstrates Small states GDP per capita. World Bank is the source of this economic data. Based on the latest available information for Small states.
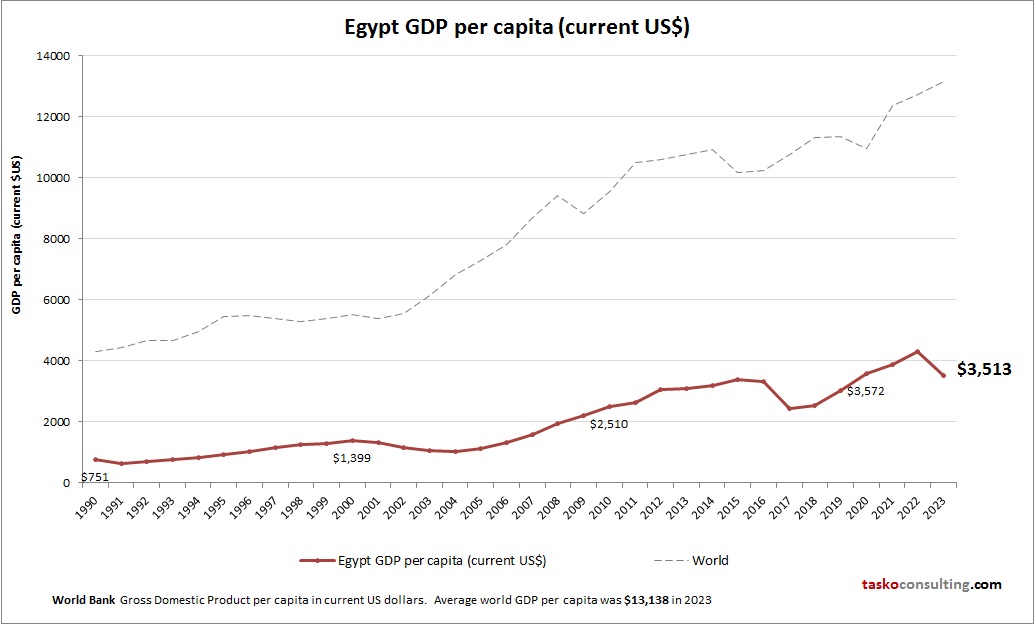
This chart demonstrates Egypt GDP per capita. The gross domestic product statistics are compiled by World Bank. Latest GDP per person information for Egypt.
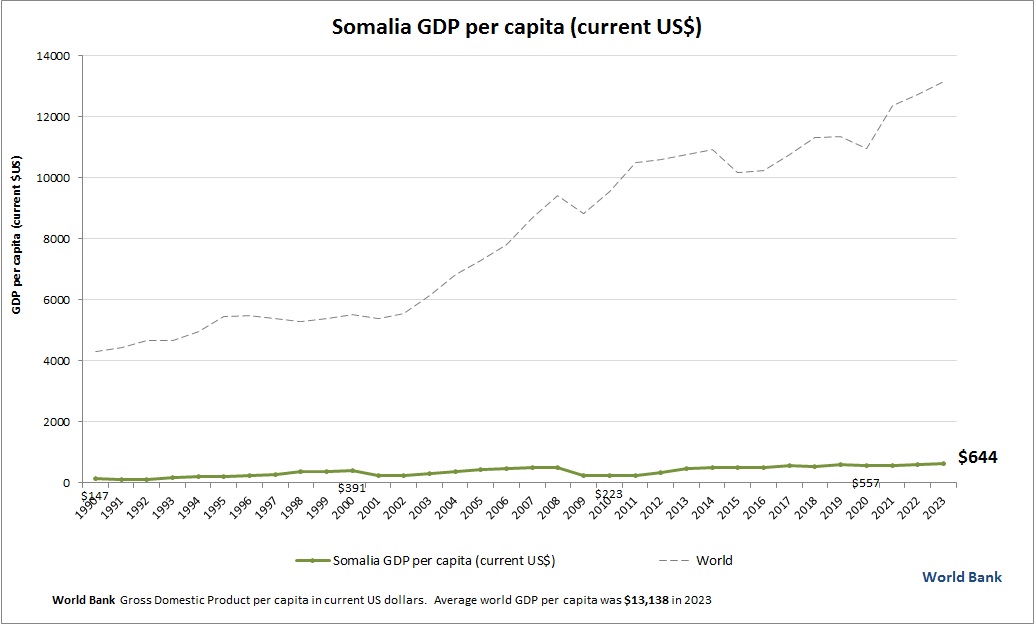
This chart demonstrates Somalia GDP per capita. World Bank is the source of this economic data. Based on the latest economic info provided for Somalia.