Skip to content
cropped cropped chart diagram1 2.png

Charts | Diagrams | Graphs

Charts | Diagrams | Graphs

Menu

Primary menu

  • Top
  • General
    • Upload Diagram
    • Sign
  • Business
  • Economy
  • Sizes
  • Anatomy
  • Health
    • Workout
    • Food
    • Stress
    • Cancer
  • IT
  • Science
    • Energy
  • Women & Men
    • Clothes
    • Military
    • Tools

Tag Archives: quality improvement framework

Continuous Improvement Processes

Posted on August 28, 2025 by chartdiagram
Continuous Improvement Processes

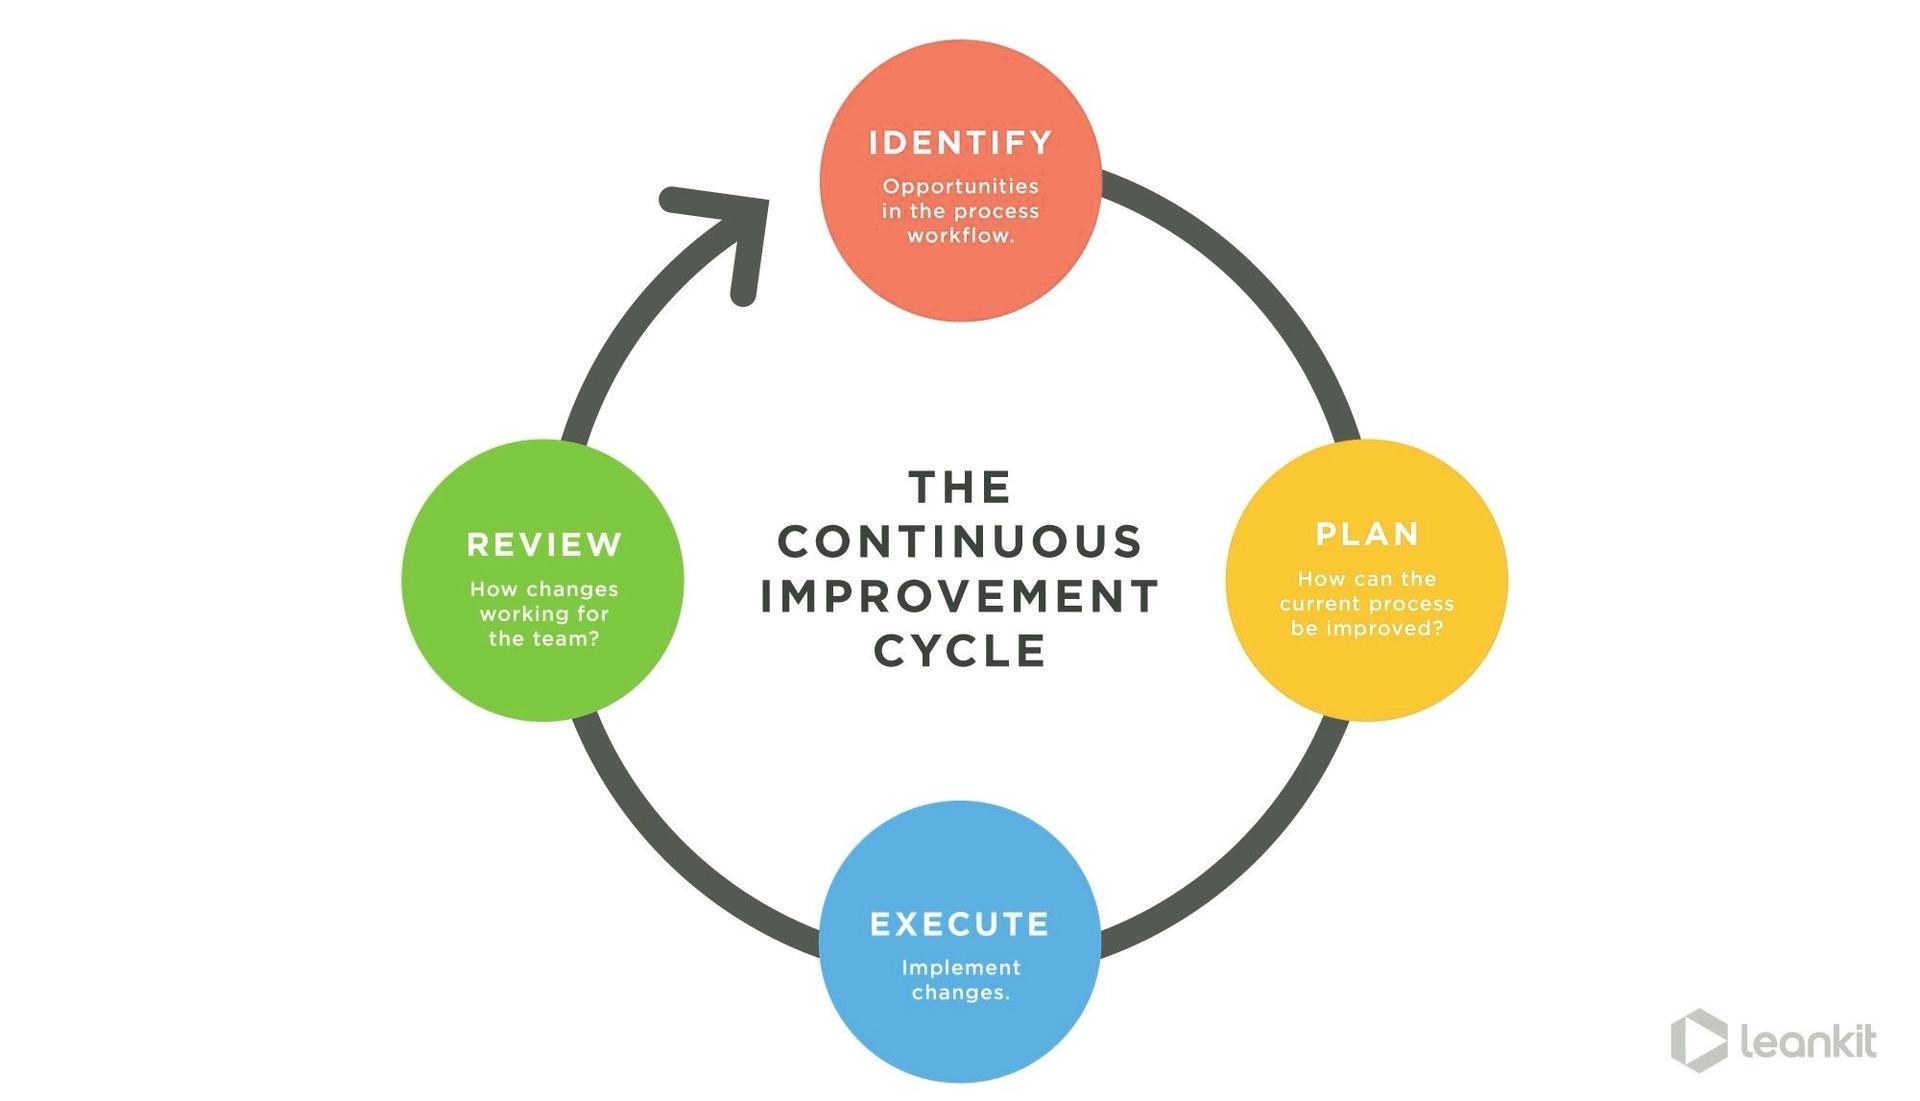
Continuous Improvement Processes: Continuous improvement processes focus on regularly assessing and enhancing organizational practices, using methodologies like Kaizen, PDCA (Plan-Do-Check-Act), and Lean Six Sigma.

Posted in Business | Tagged continuous improvement diagram, Kaizen model, lean optimization, process enhancement strategy, quality improvement framework

Primary Sidebar Widget Area

Top Diagrams

  • Agile model of software development the development cycle Agile Model of Software Development the Development Cycle

  • endocrine system diagram Endocrine System Diagram

  • Modern circle diagram template for powerpoint Modern Circle Diagram Template for PowerPoint

  • New product launch New Product Launch

  • Eye Colors

  • Situational leadership model Situational Leadership Model

  • Libya GDP per capita Libya GDP per capita

  • Relationship Diagram

  • Health Venn Diagram Graphic Health Venn Diagram Graphic

  • Fastener size chart Fastener size chart

  • Eye Workout Eye Workout

  • Economic Flow Chart Economic Flow Chart

  • Microscope Diagram

  • Left Vs Right In Us Politics Left Vs Right In Us Politics

  • Artificial Intelligence AI Technique Artificial Intelligence AI Technique

  • South Sudan GDP per capita South Sudan GDP per capita

  • Wellness

  • Ear Diagram – Ear Anatomy

  • Global Economy In 5 Charts Global Economy In 5 Charts

  • value stream map Value Stream Map

Latest Posts

  • New Product Launch
  • Modern Circle Diagram Template for PowerPoint
  • Afghanistan GDP per capita
  • Leadership and Management
  • Enterprise Business Architecture Framework
  • Human Excretory System Represented
  • BeFunky Collage
  • Adkar change management model google slides templates
  • Marketing Sales Funnel
  • Leadership Pyramid Leadership
  • Learning for Life Programme Community
  • Best change management images on pinterest
  • Leadership Diagram Circle
  • Business Concept Diagram
  • Eswatini GDP per capita

Top 20 Tags

  • size (30)
  • food (7)
  • food chart (7)
  • food diagram (7)
  • skin (6)
  • cities (6)
  • world (6)
  • population (6)
  • conversion (6)
  • cancer (5)
  • alcohol diagram (5)
  • business strategy diagram (5)
  • sales process diagram (5)
  • car diagram (4)
  • water cycle (4)
  • stress (4)
  • how stress affects body (4)
  • yoga (4)
  • yoga poses (4)
  • yoga workout (4)

Category

  • Anatomy
  • Business
  • Cancer
  • Clothes
  • Economy
  • Energy
  • Food
  • General
  • Health
  • IT
  • Military
  • Science
  • Sign
  • Sizes
  • Stress
  • Tools
  • Top
  • Women & Men
  • Workout
Copyright © 2026 Charts | Diagrams | Graphs. All Rights Reserved.
Theme: Catch Box by Catch Themes
Scroll Up