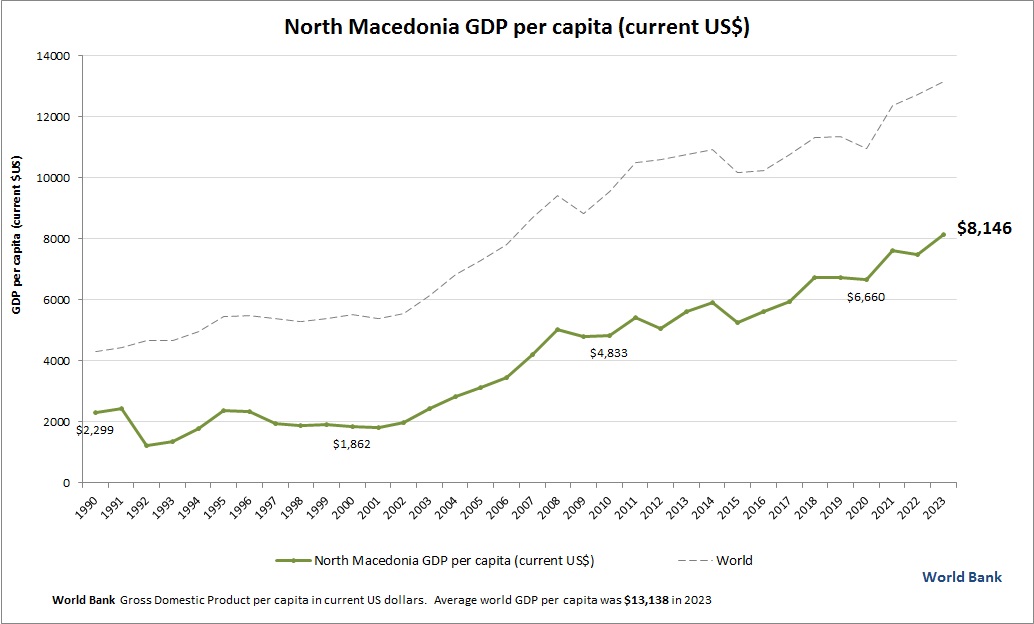
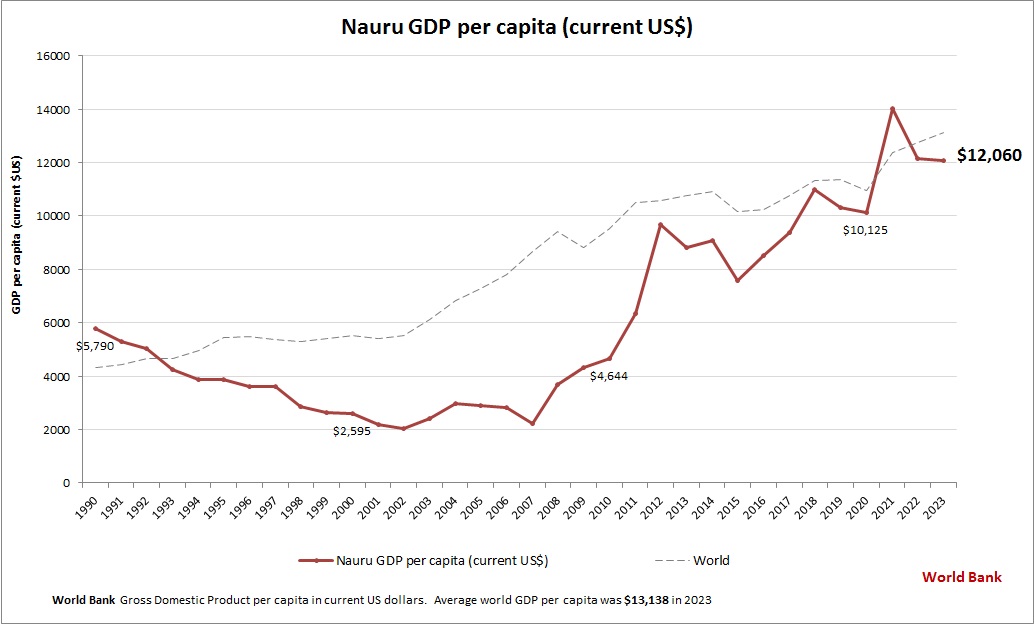
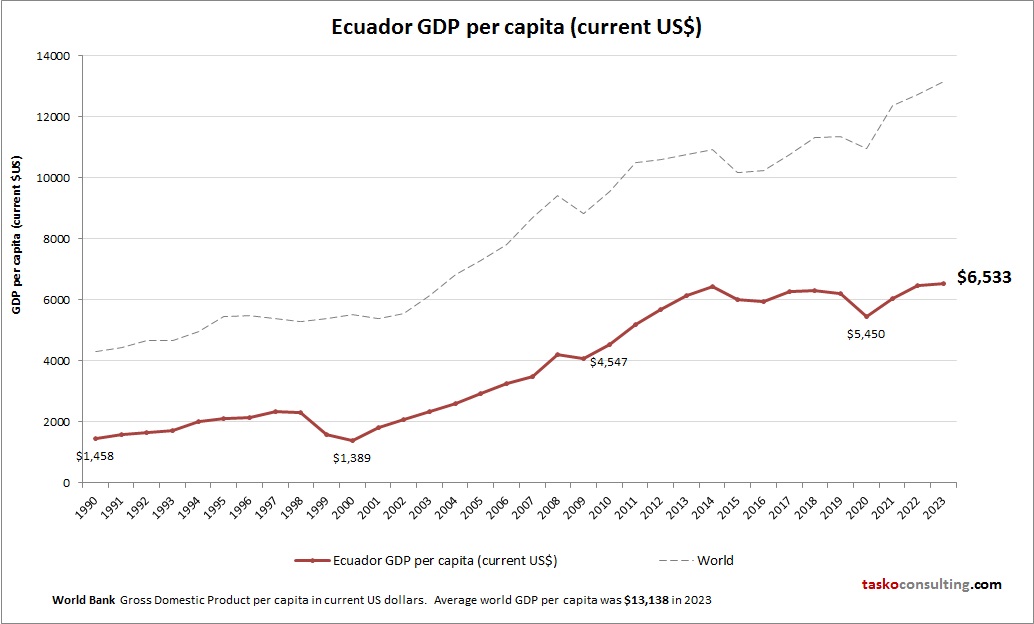
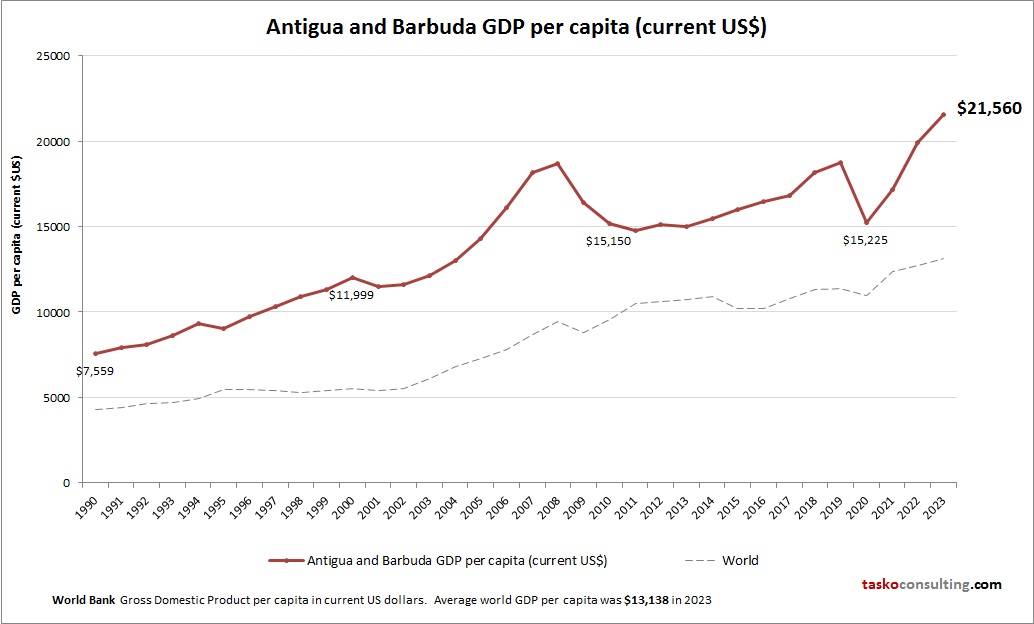
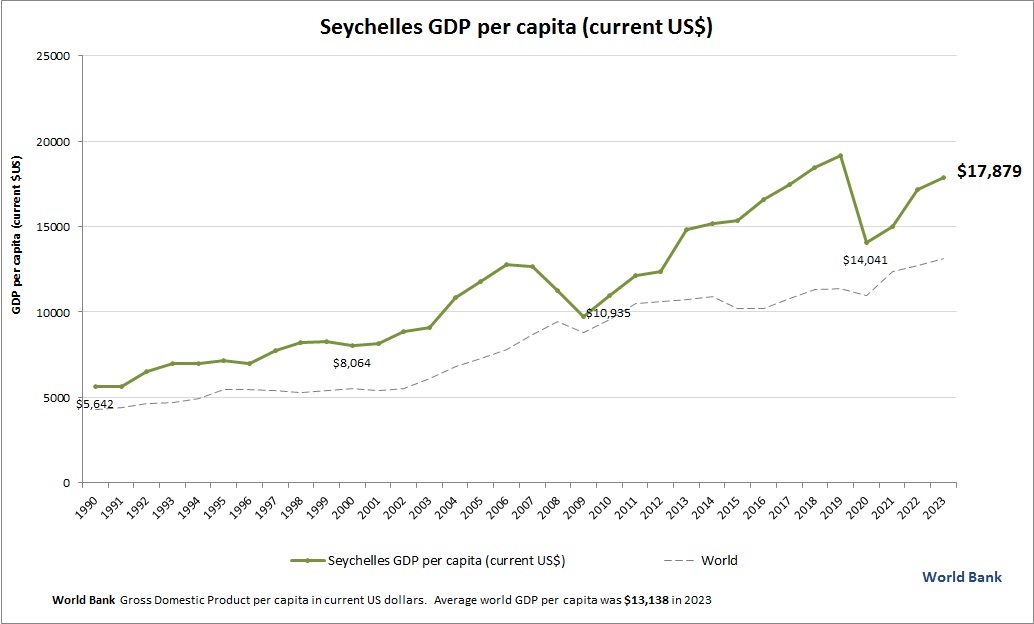
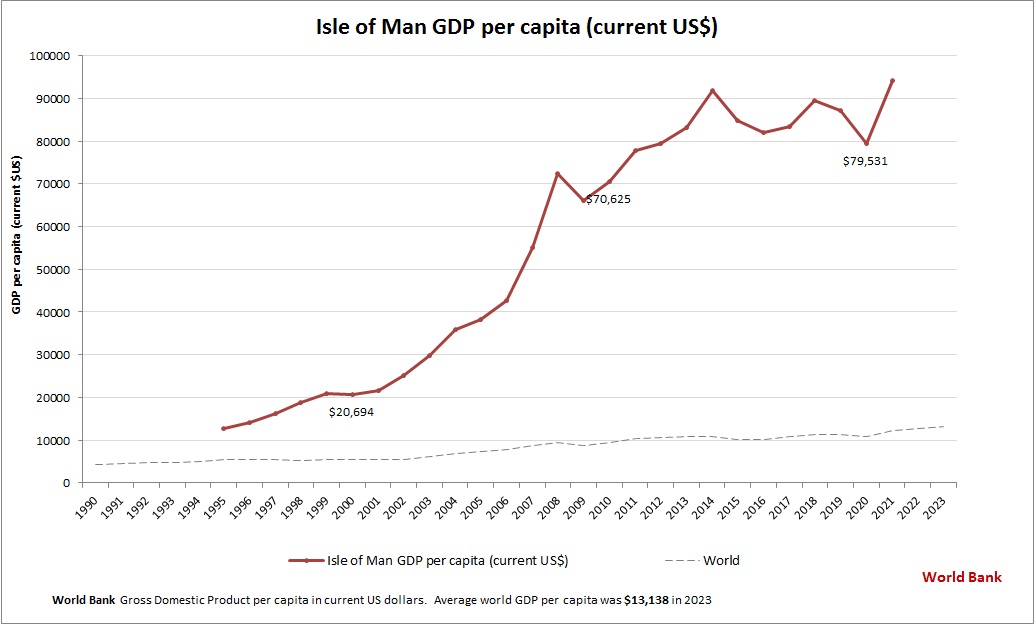
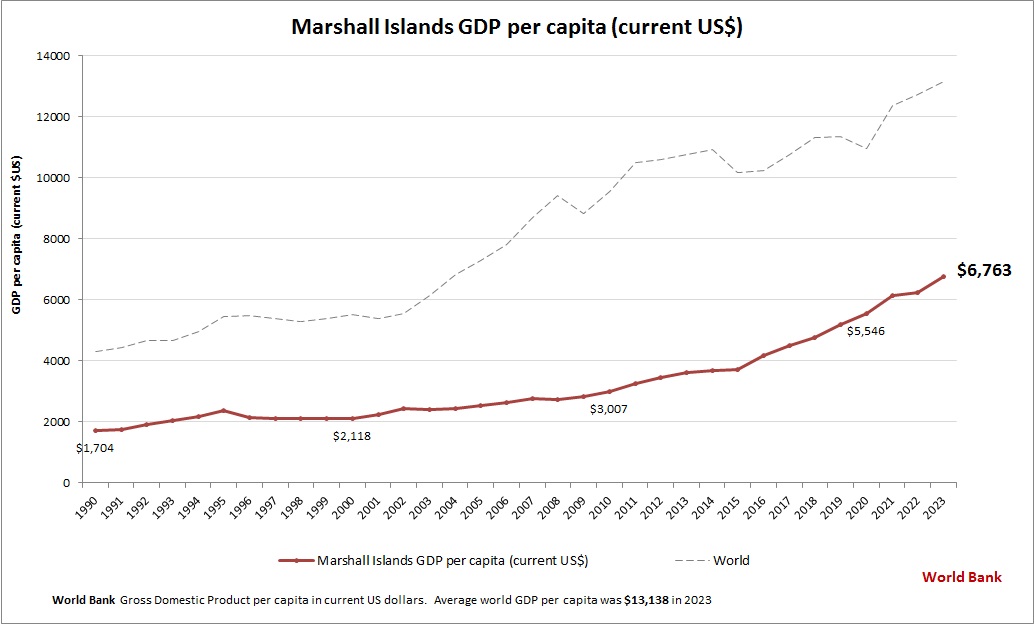
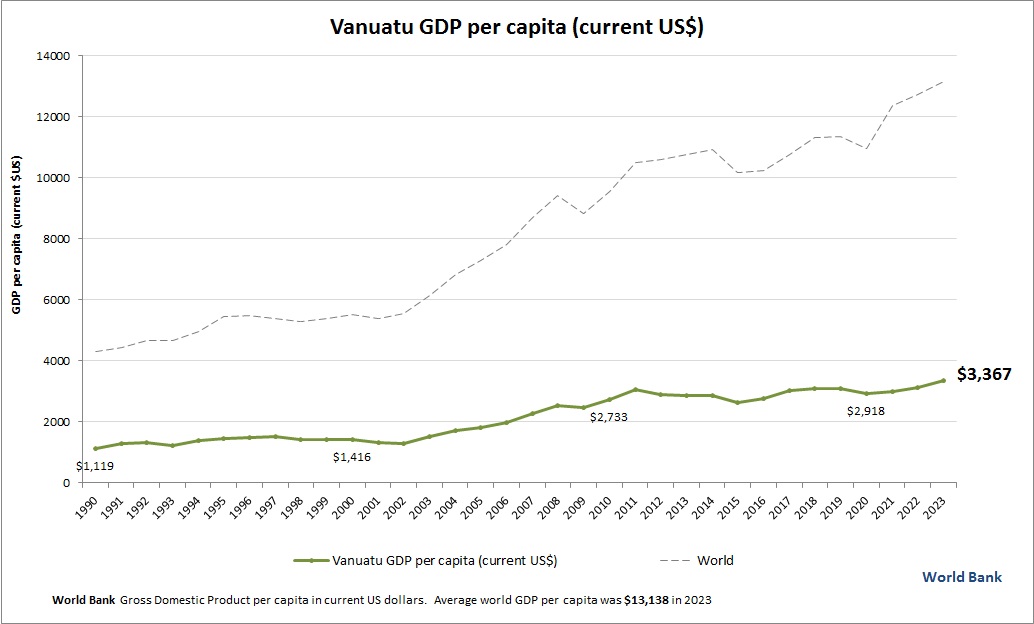
Post demographic dividend GDP per capita
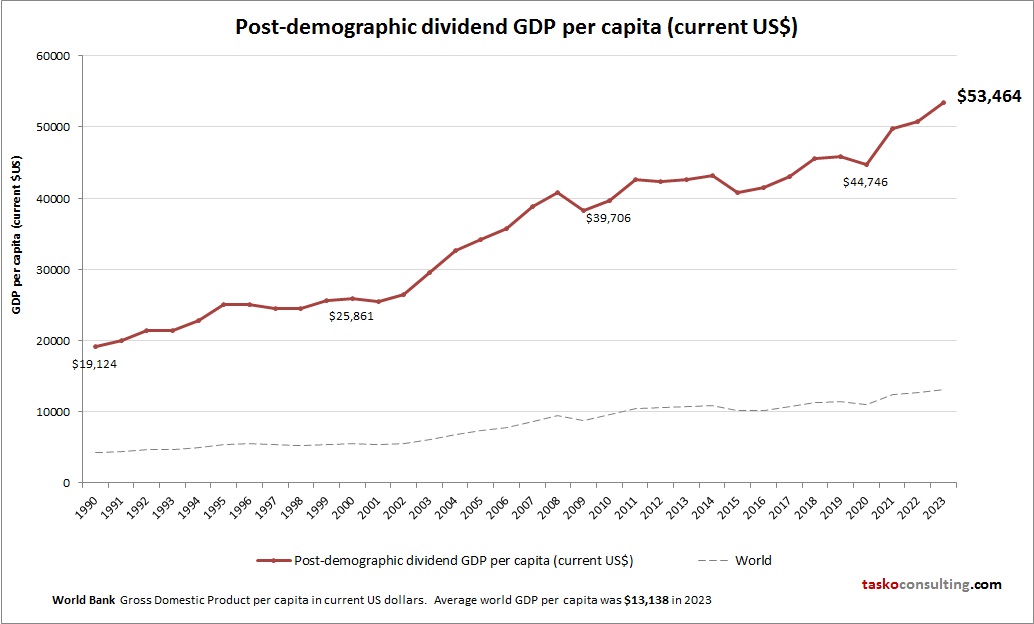
This chart demonstrates Post demographic dividend GDP per capita. This is according to World Bank GDP stats by country. Latest GDP per person information for Post demographic dividend.